About Me
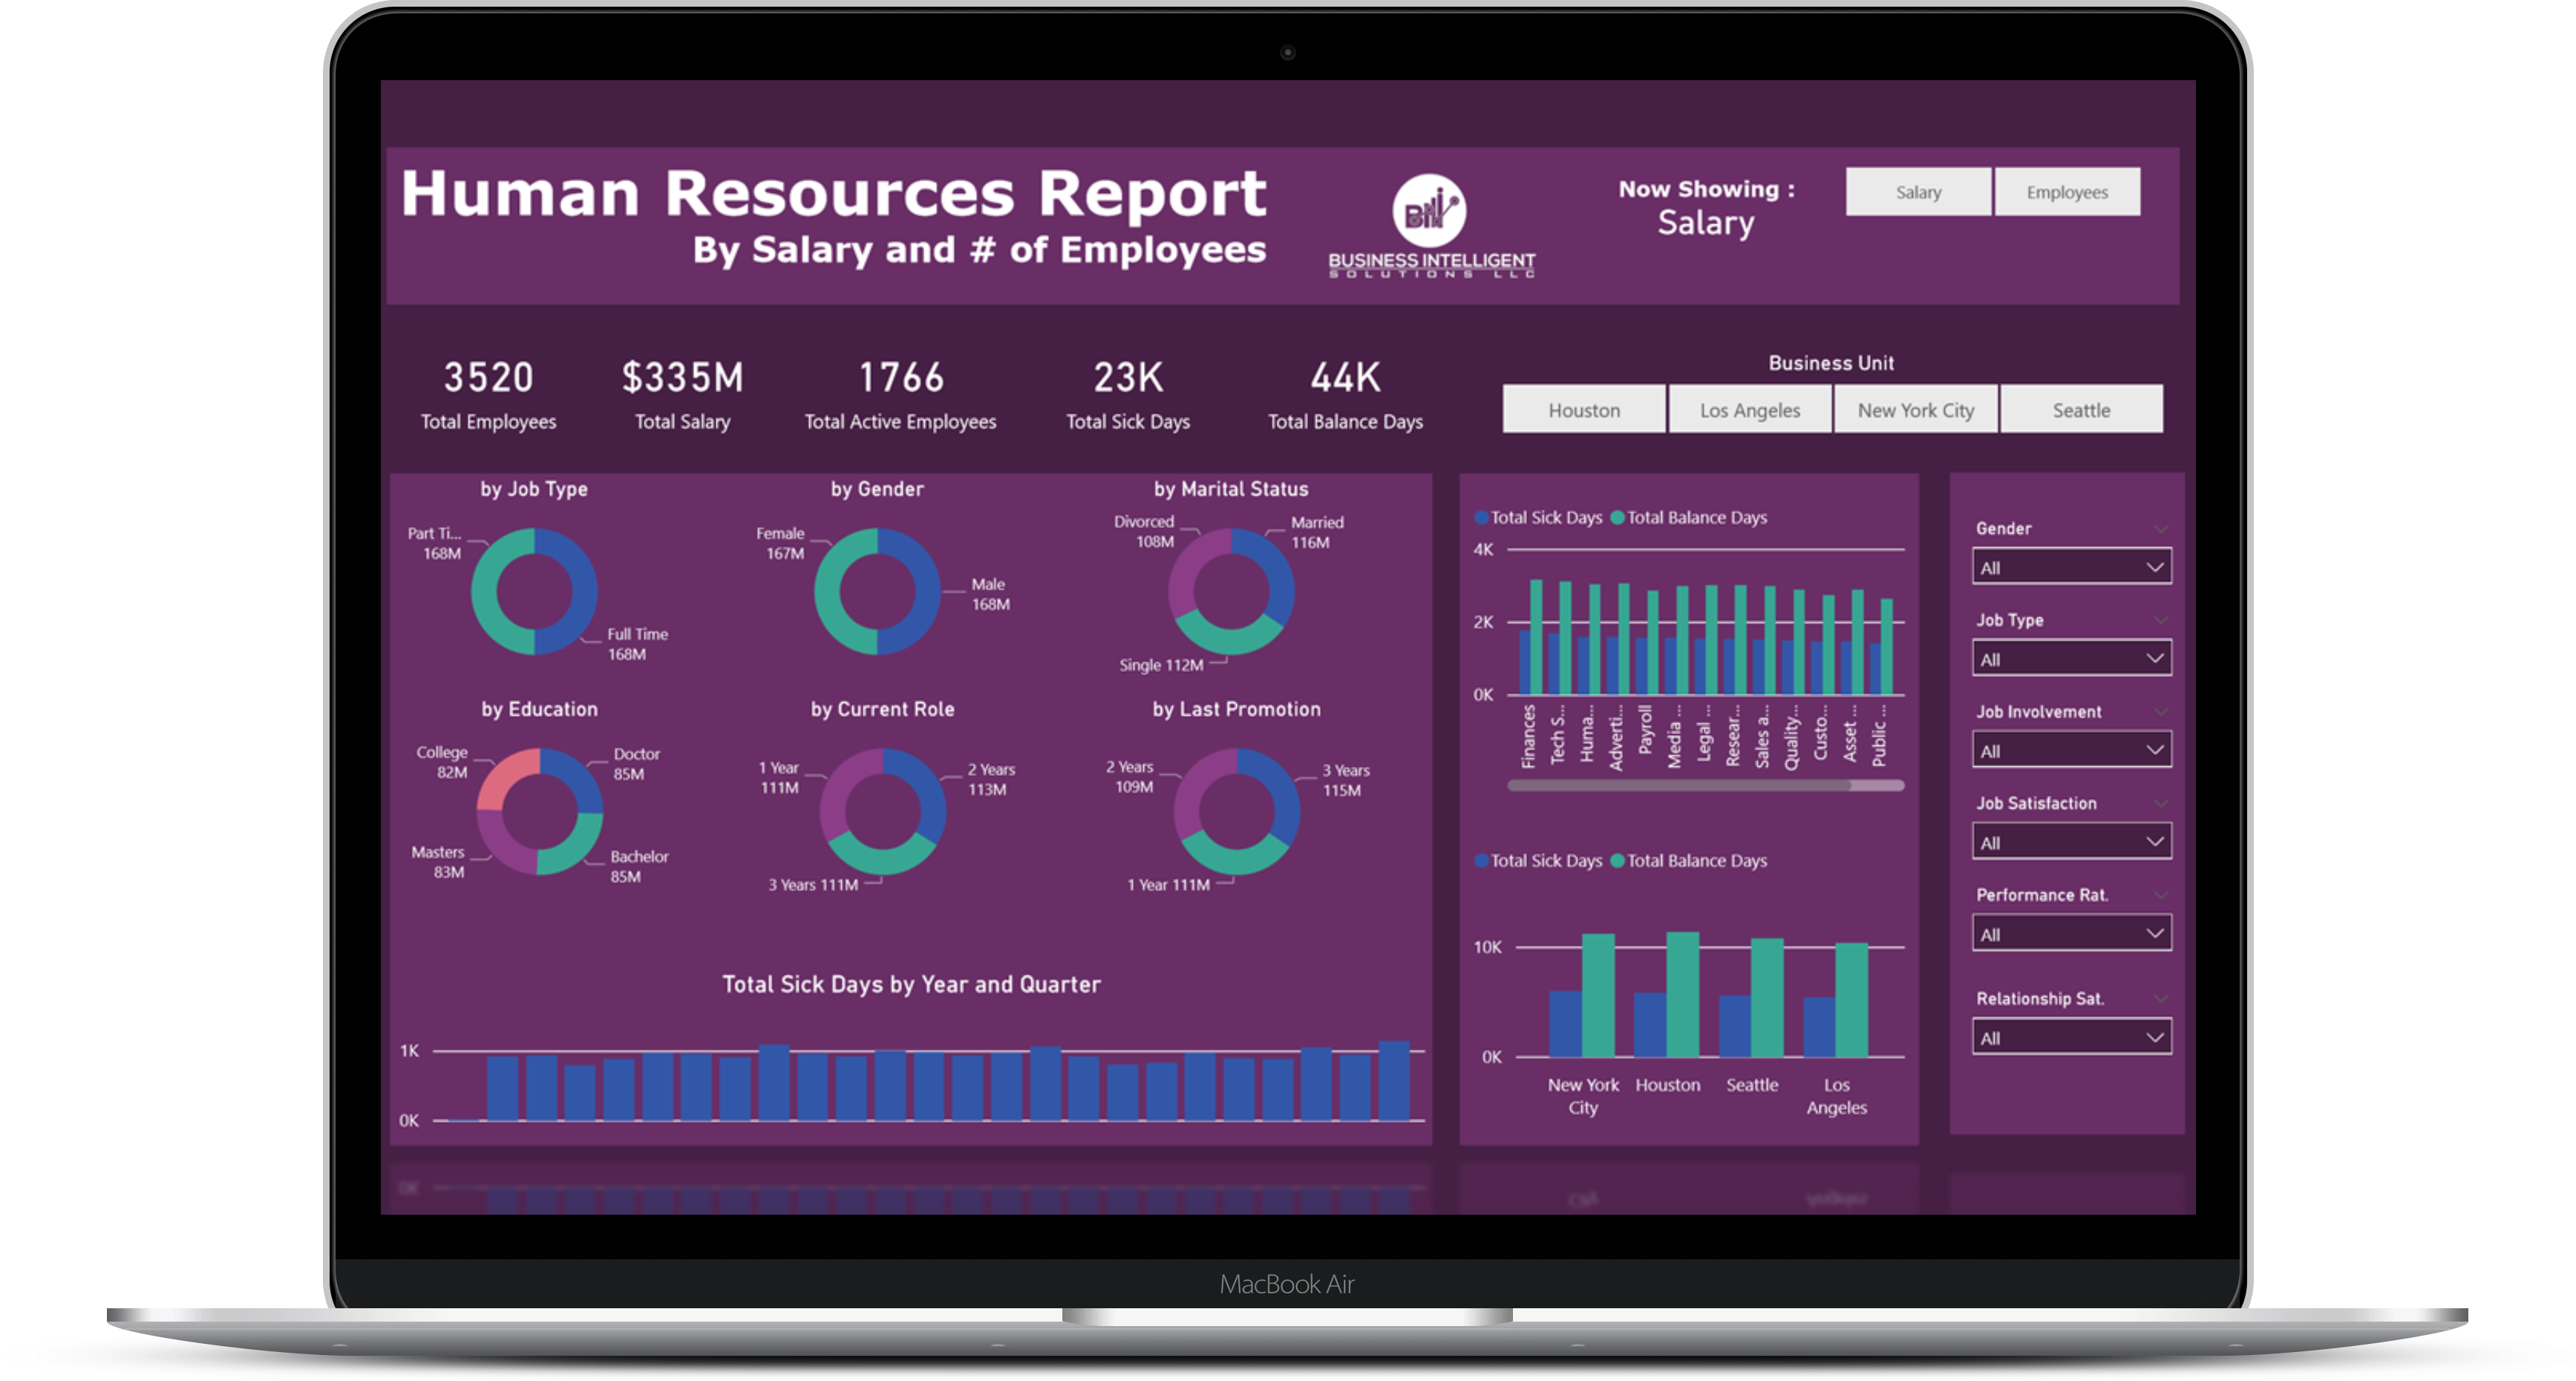
A showcase of personal data visualization projects developed using Power BI, Tableau, Excel, and Google Data Studio

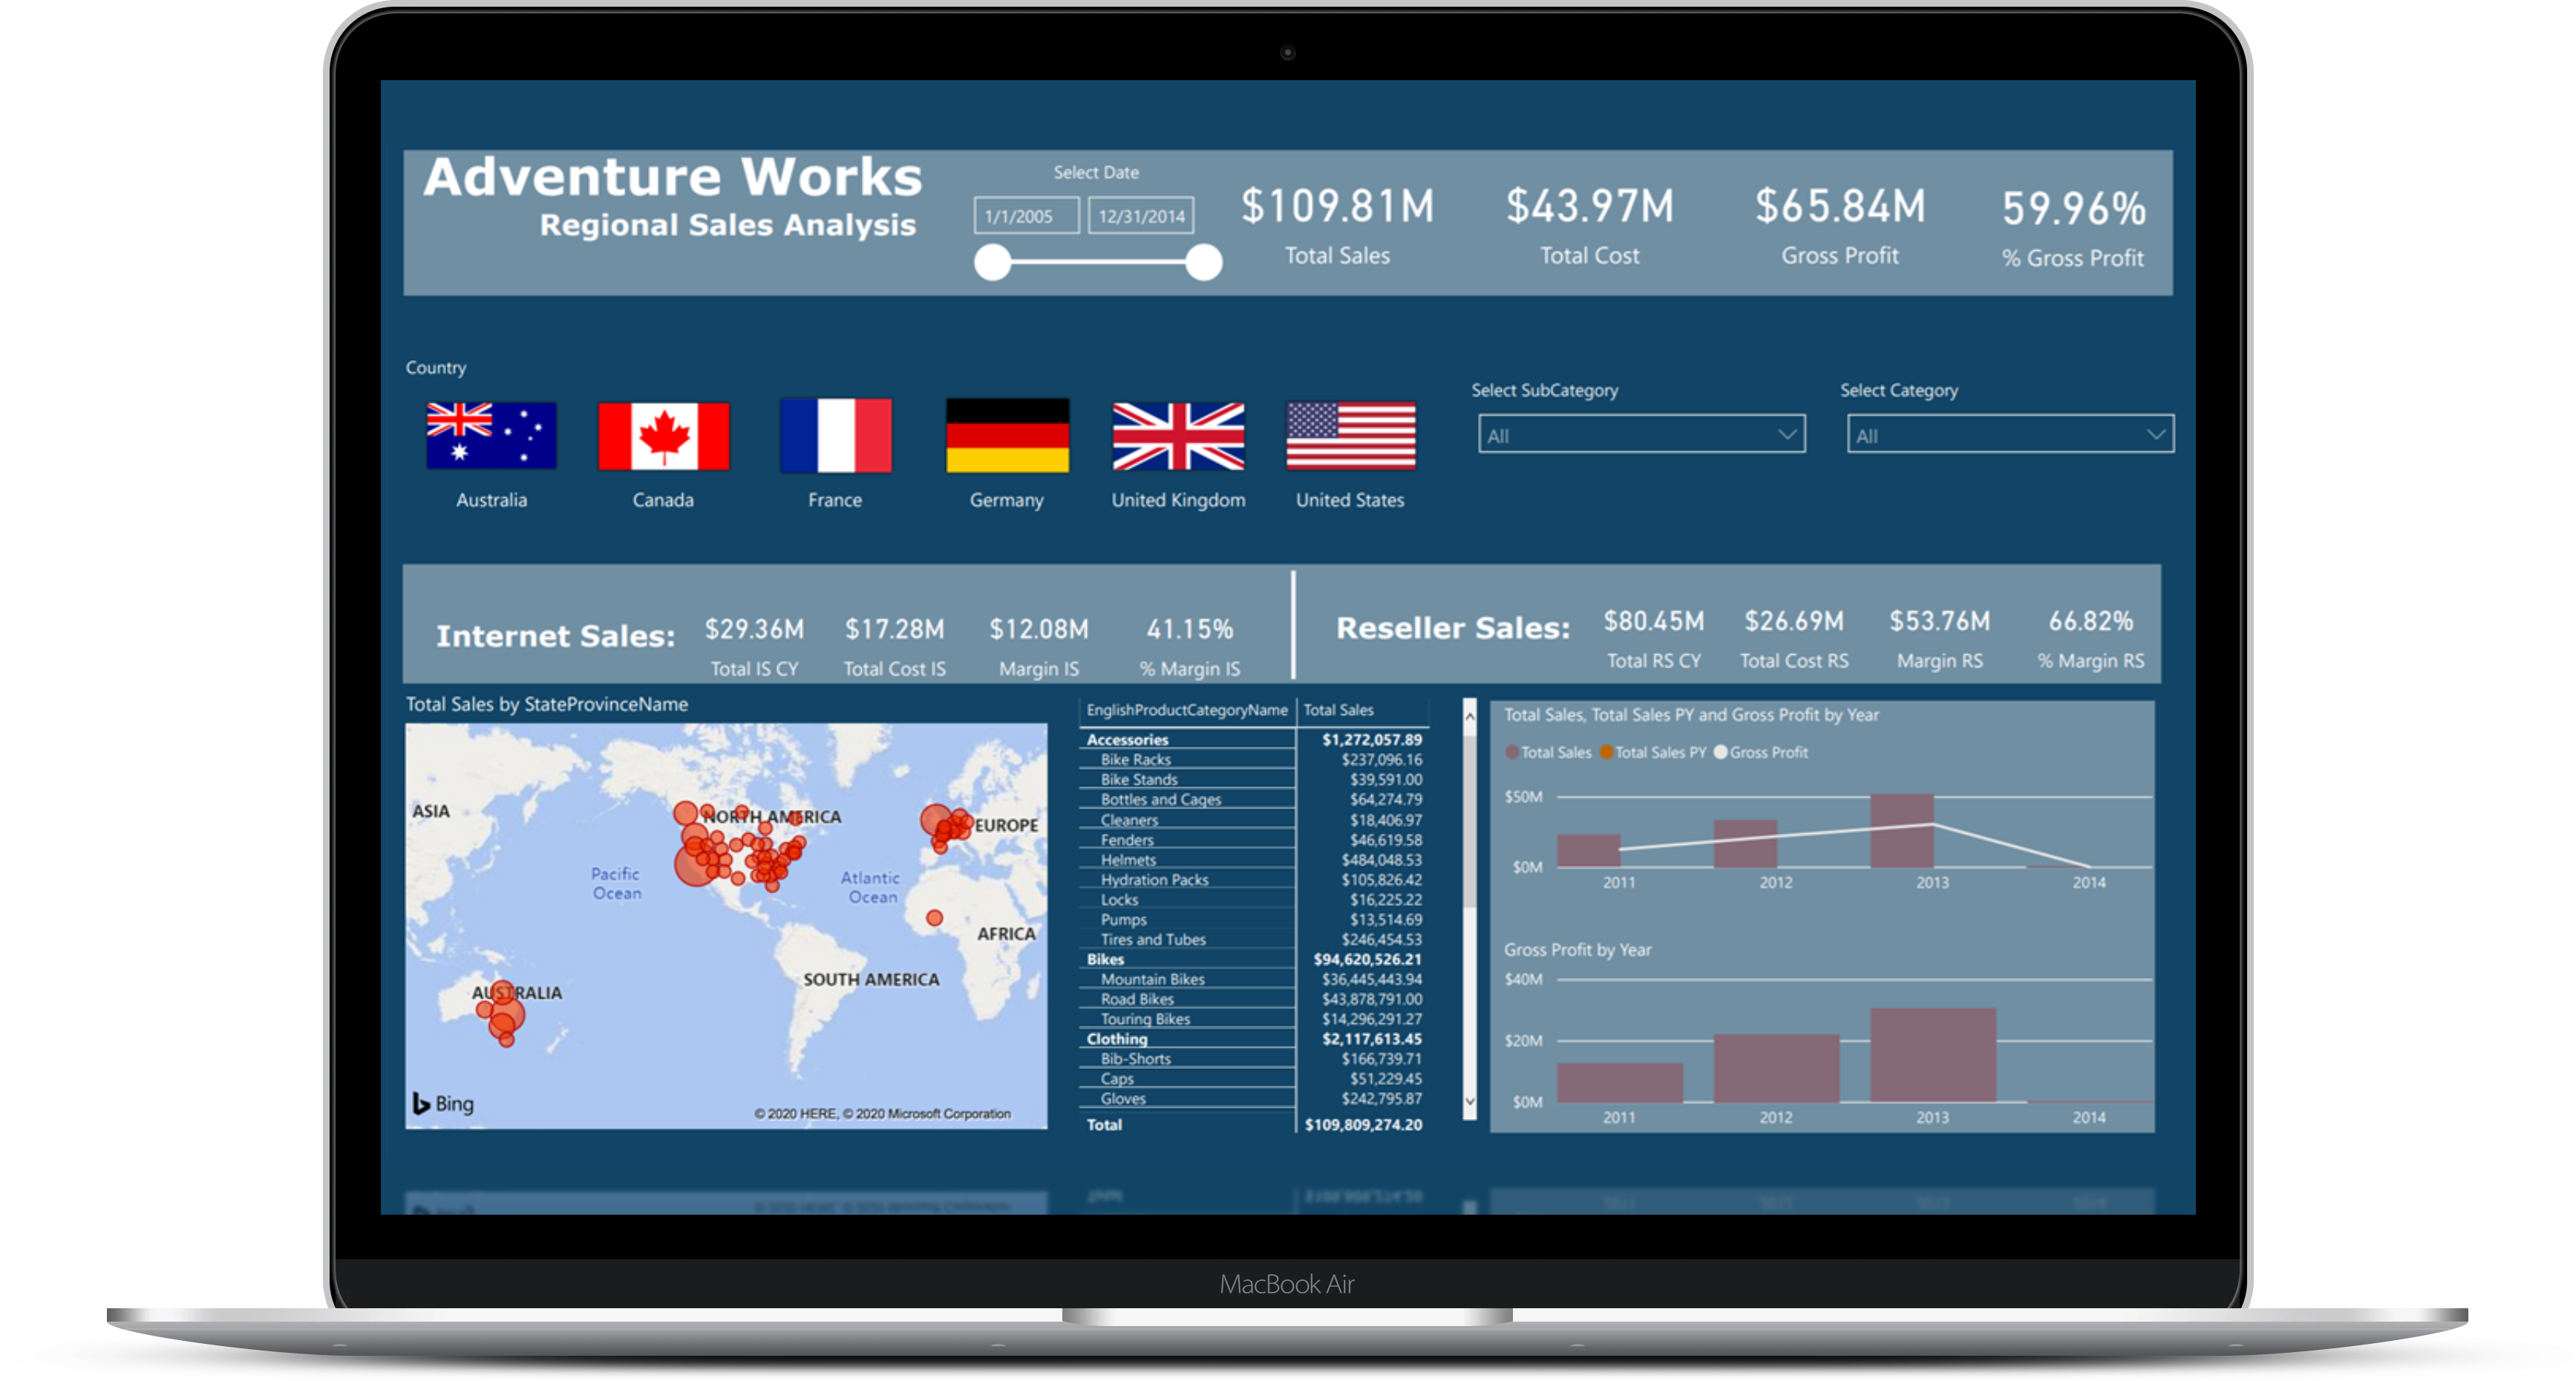
Regional sales report that displays the amount of internet seller & reseller sales across separate countries. Developed using custom DAX measures and SQL Server.
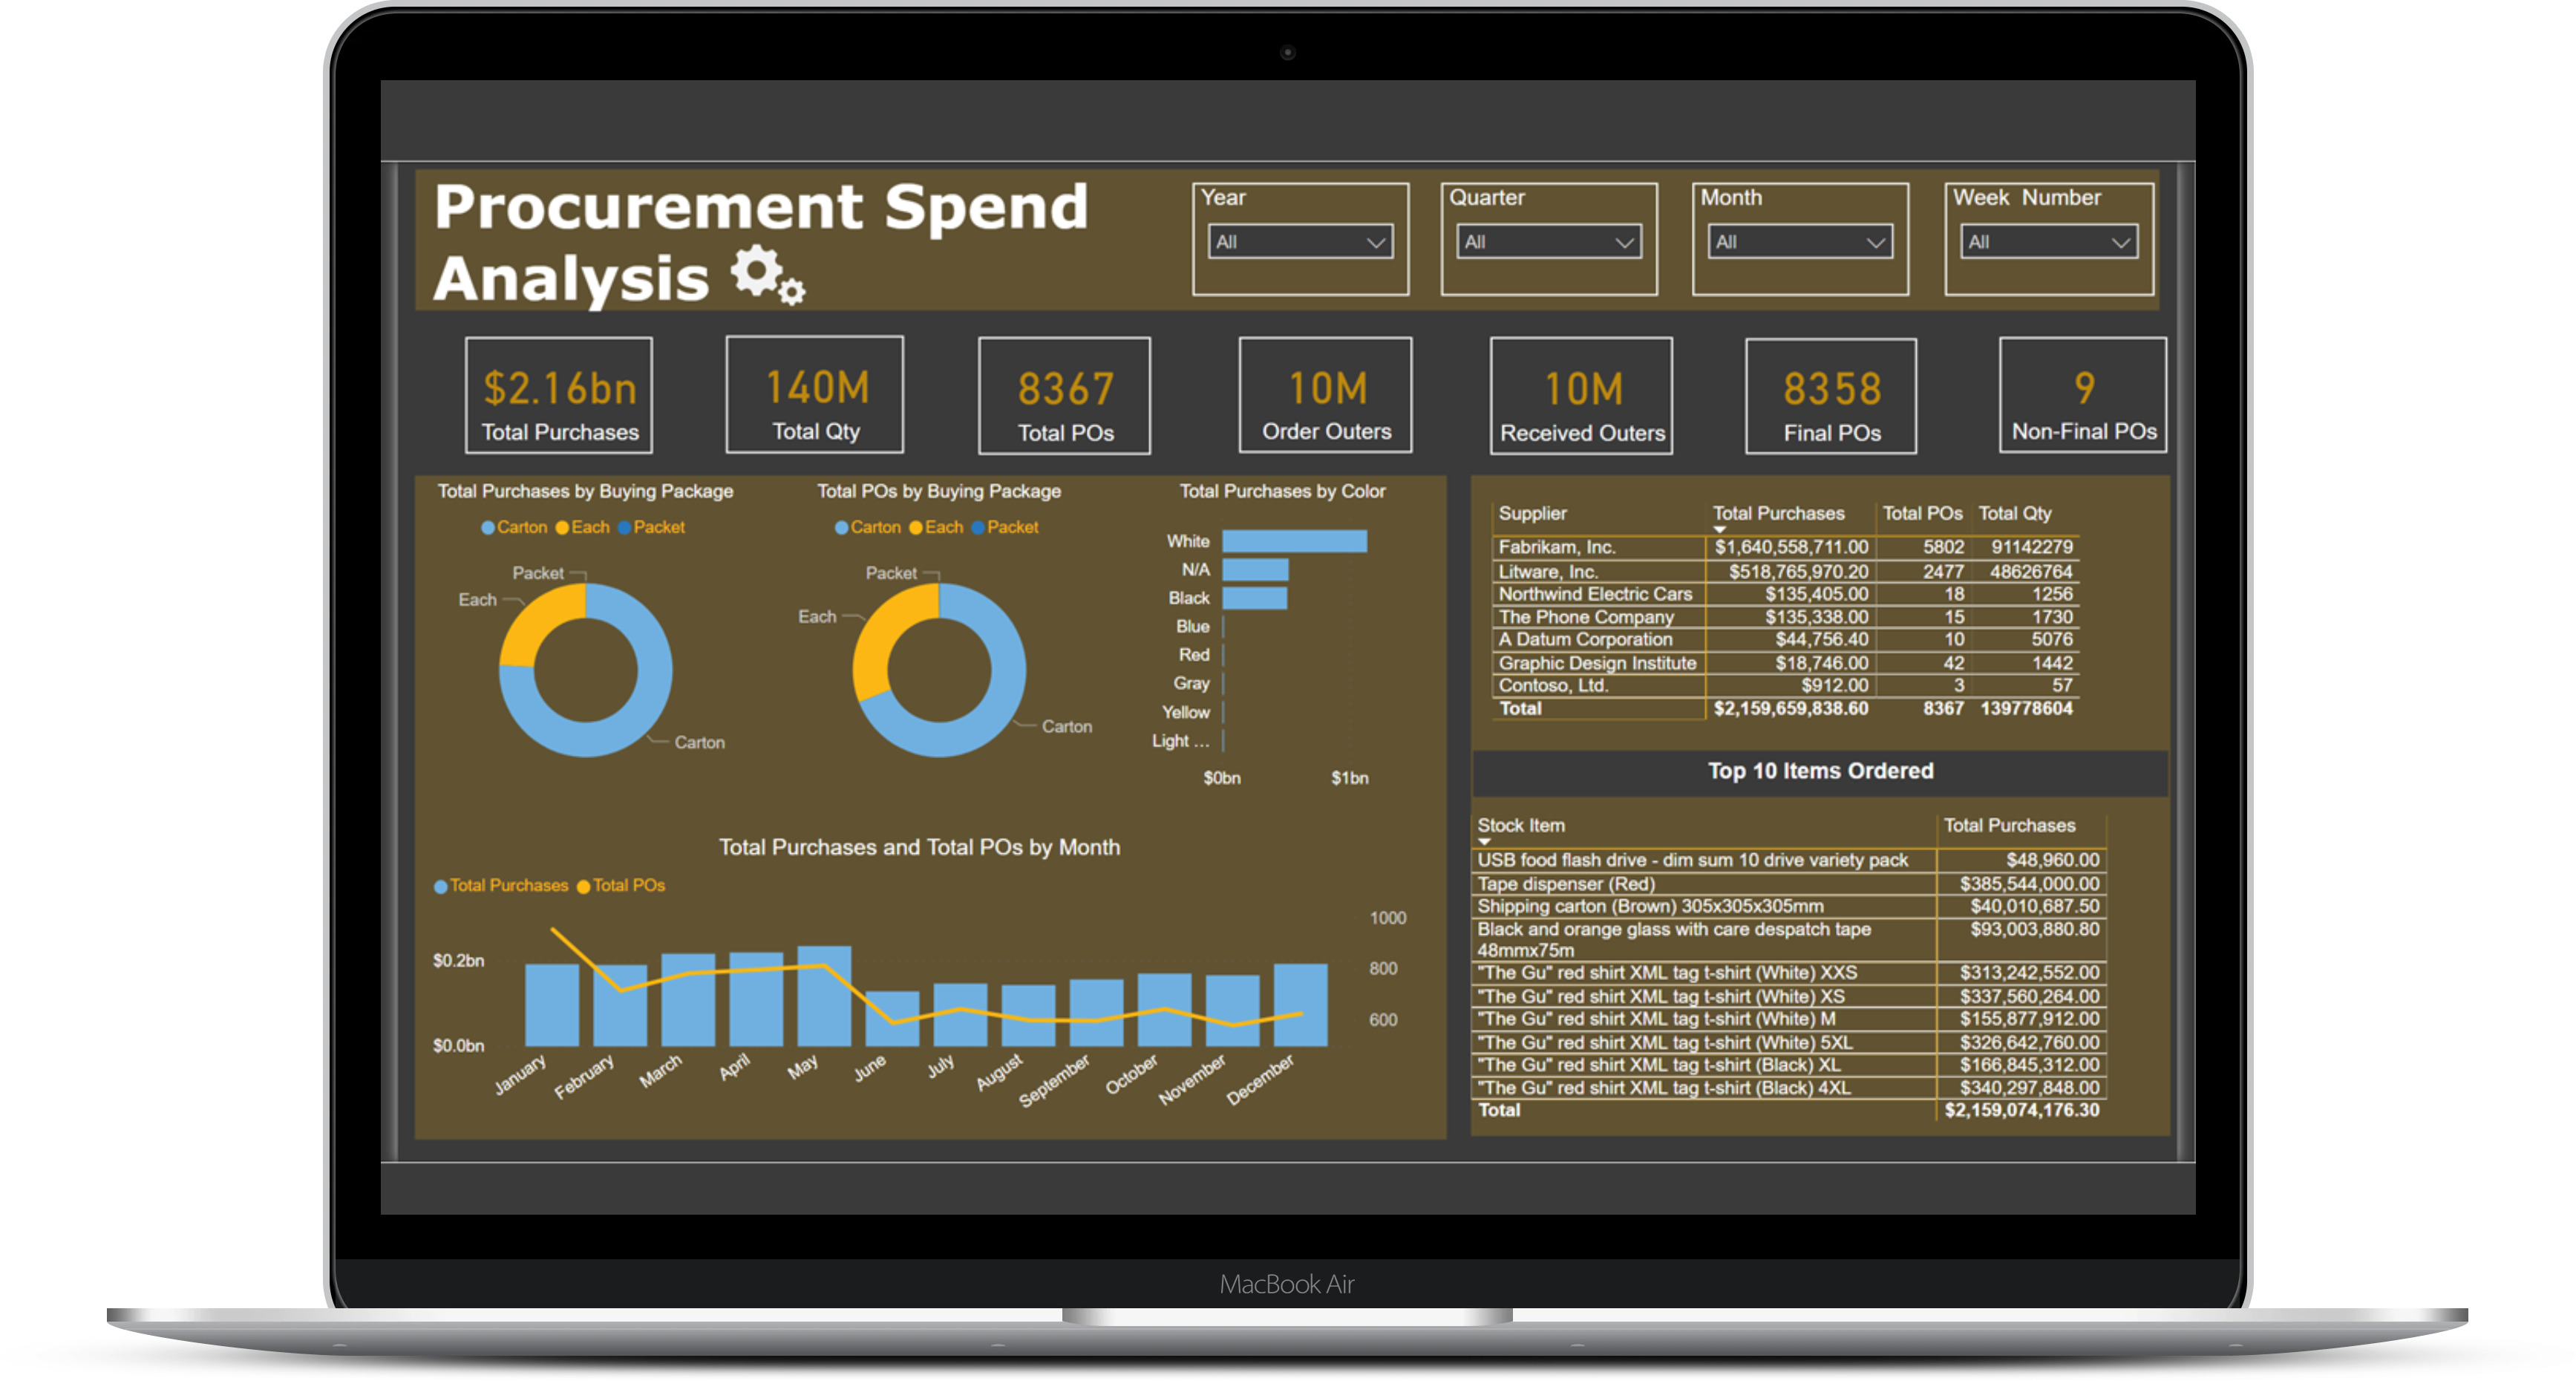
Procurement spend analysis that details the purchase quantity and amount by major supplier. Developed using custom DAX measures and SQL Server.
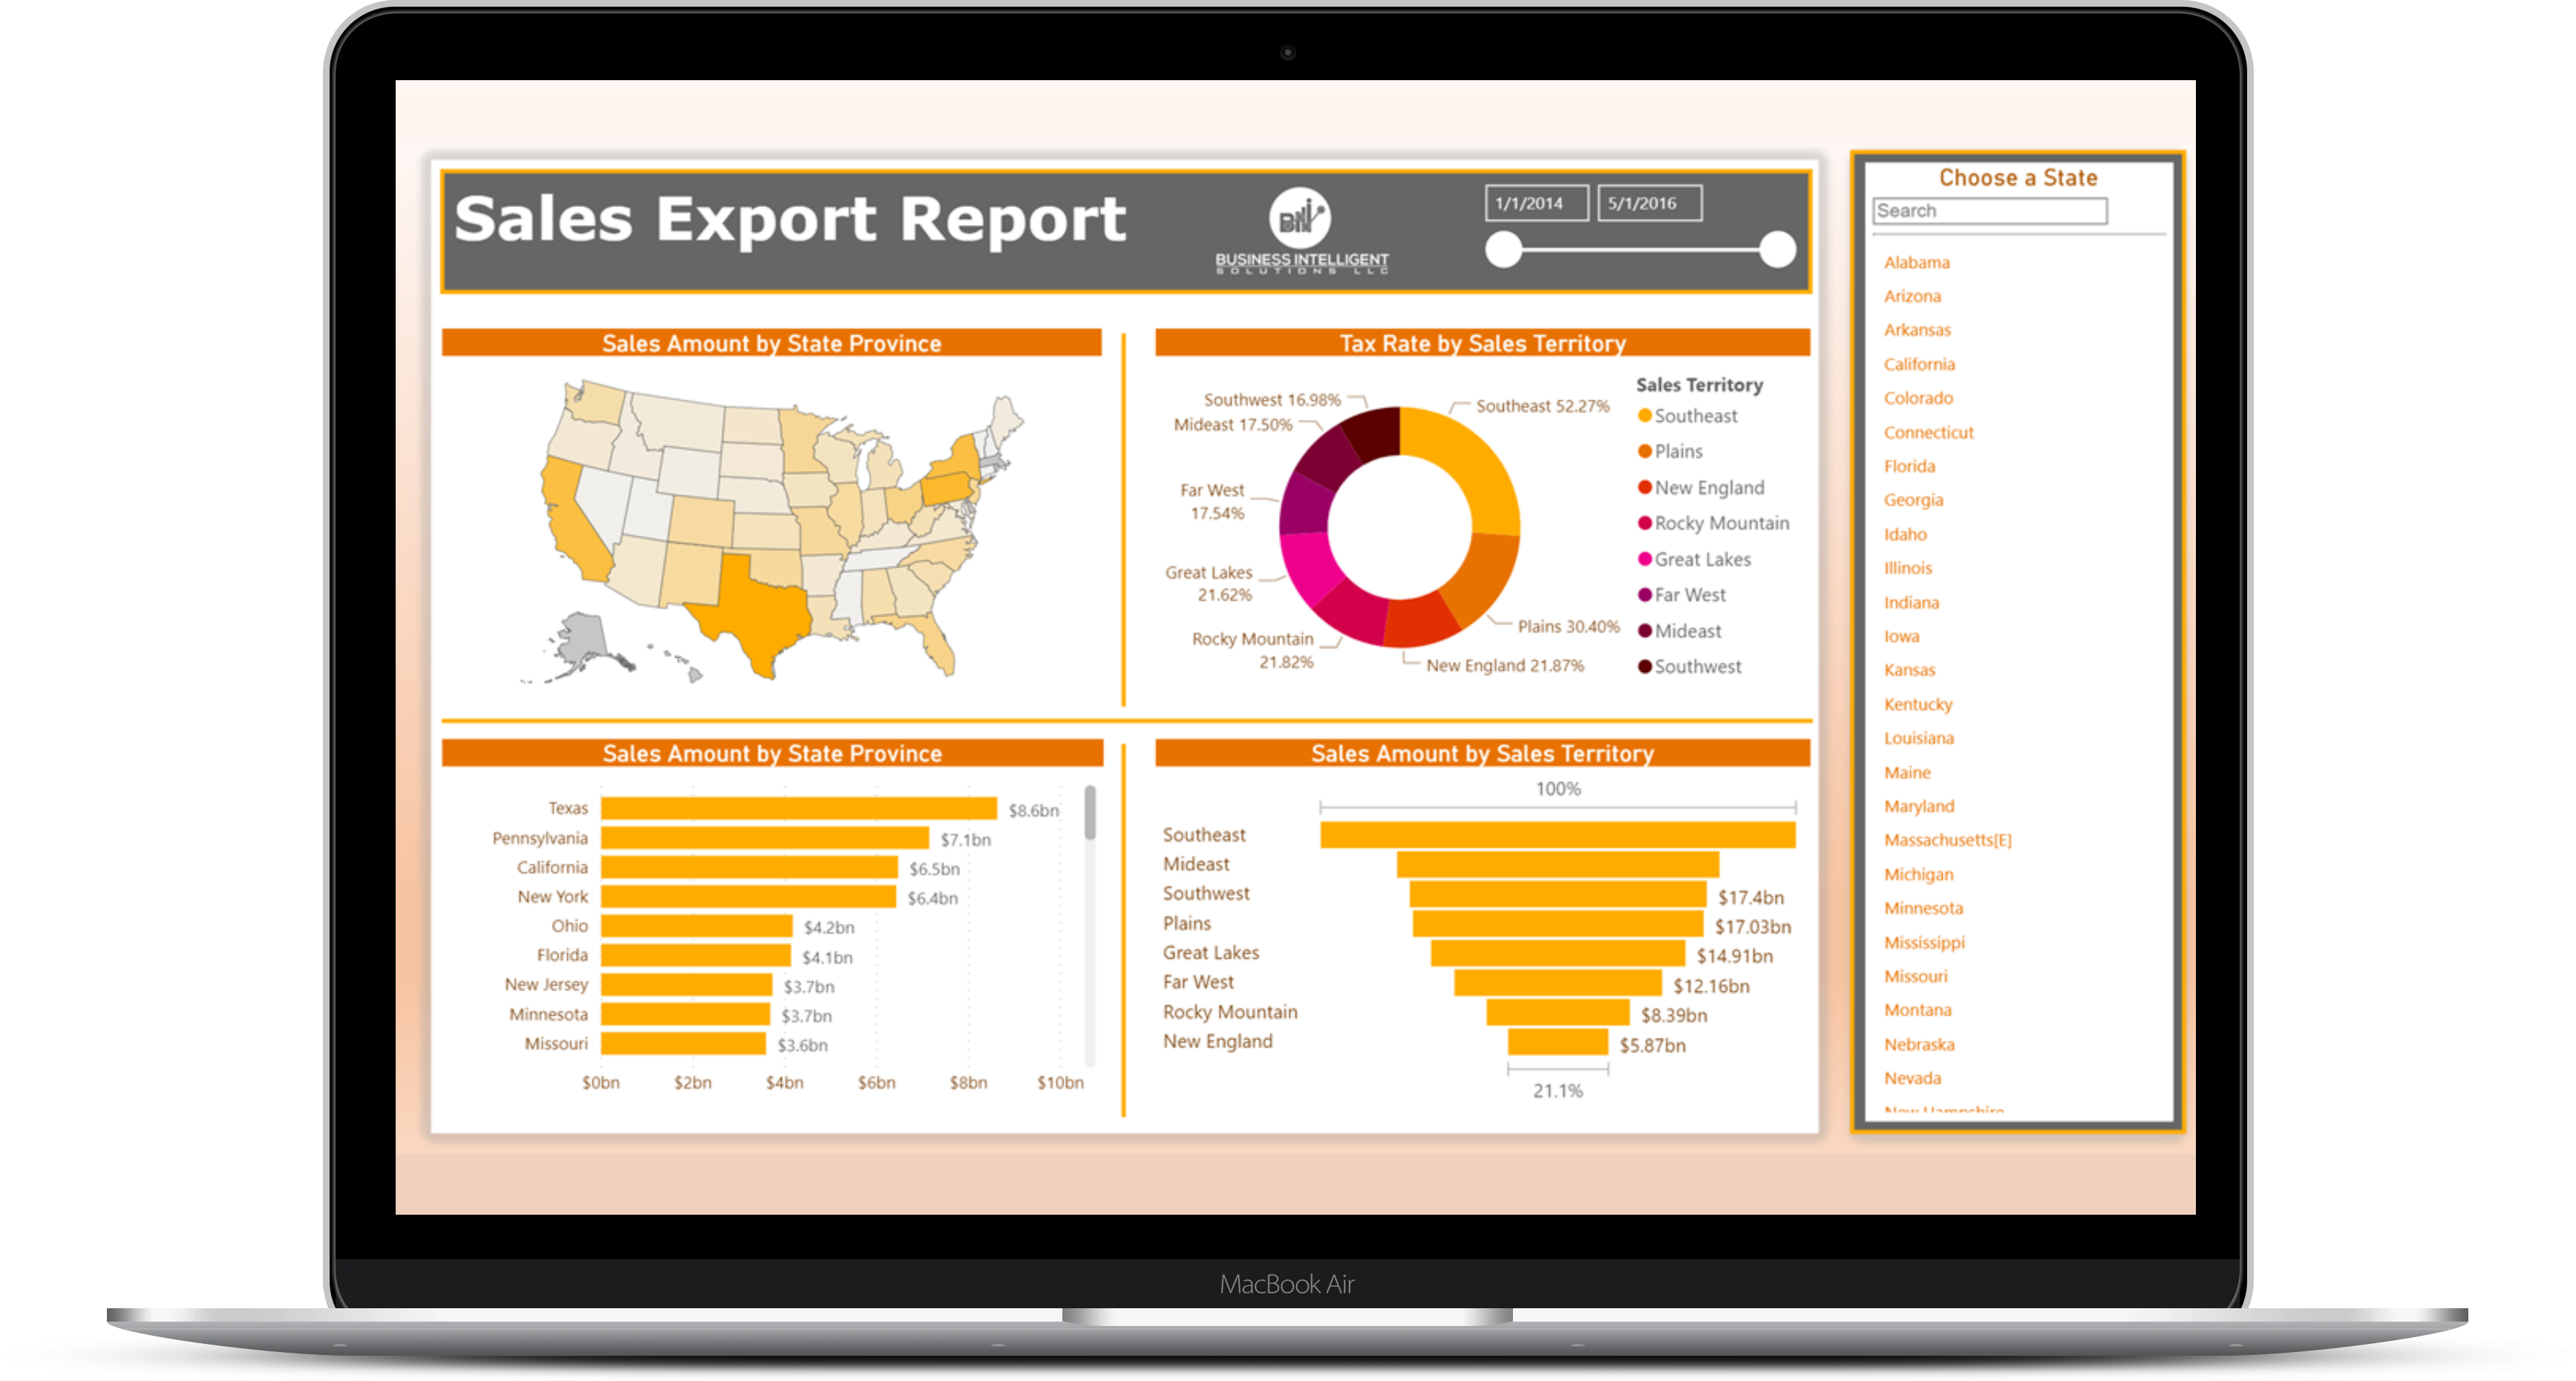
Sales export report that displays the total United States sales exports by territory and state. Developed using custom DAX measures and Excel data source.
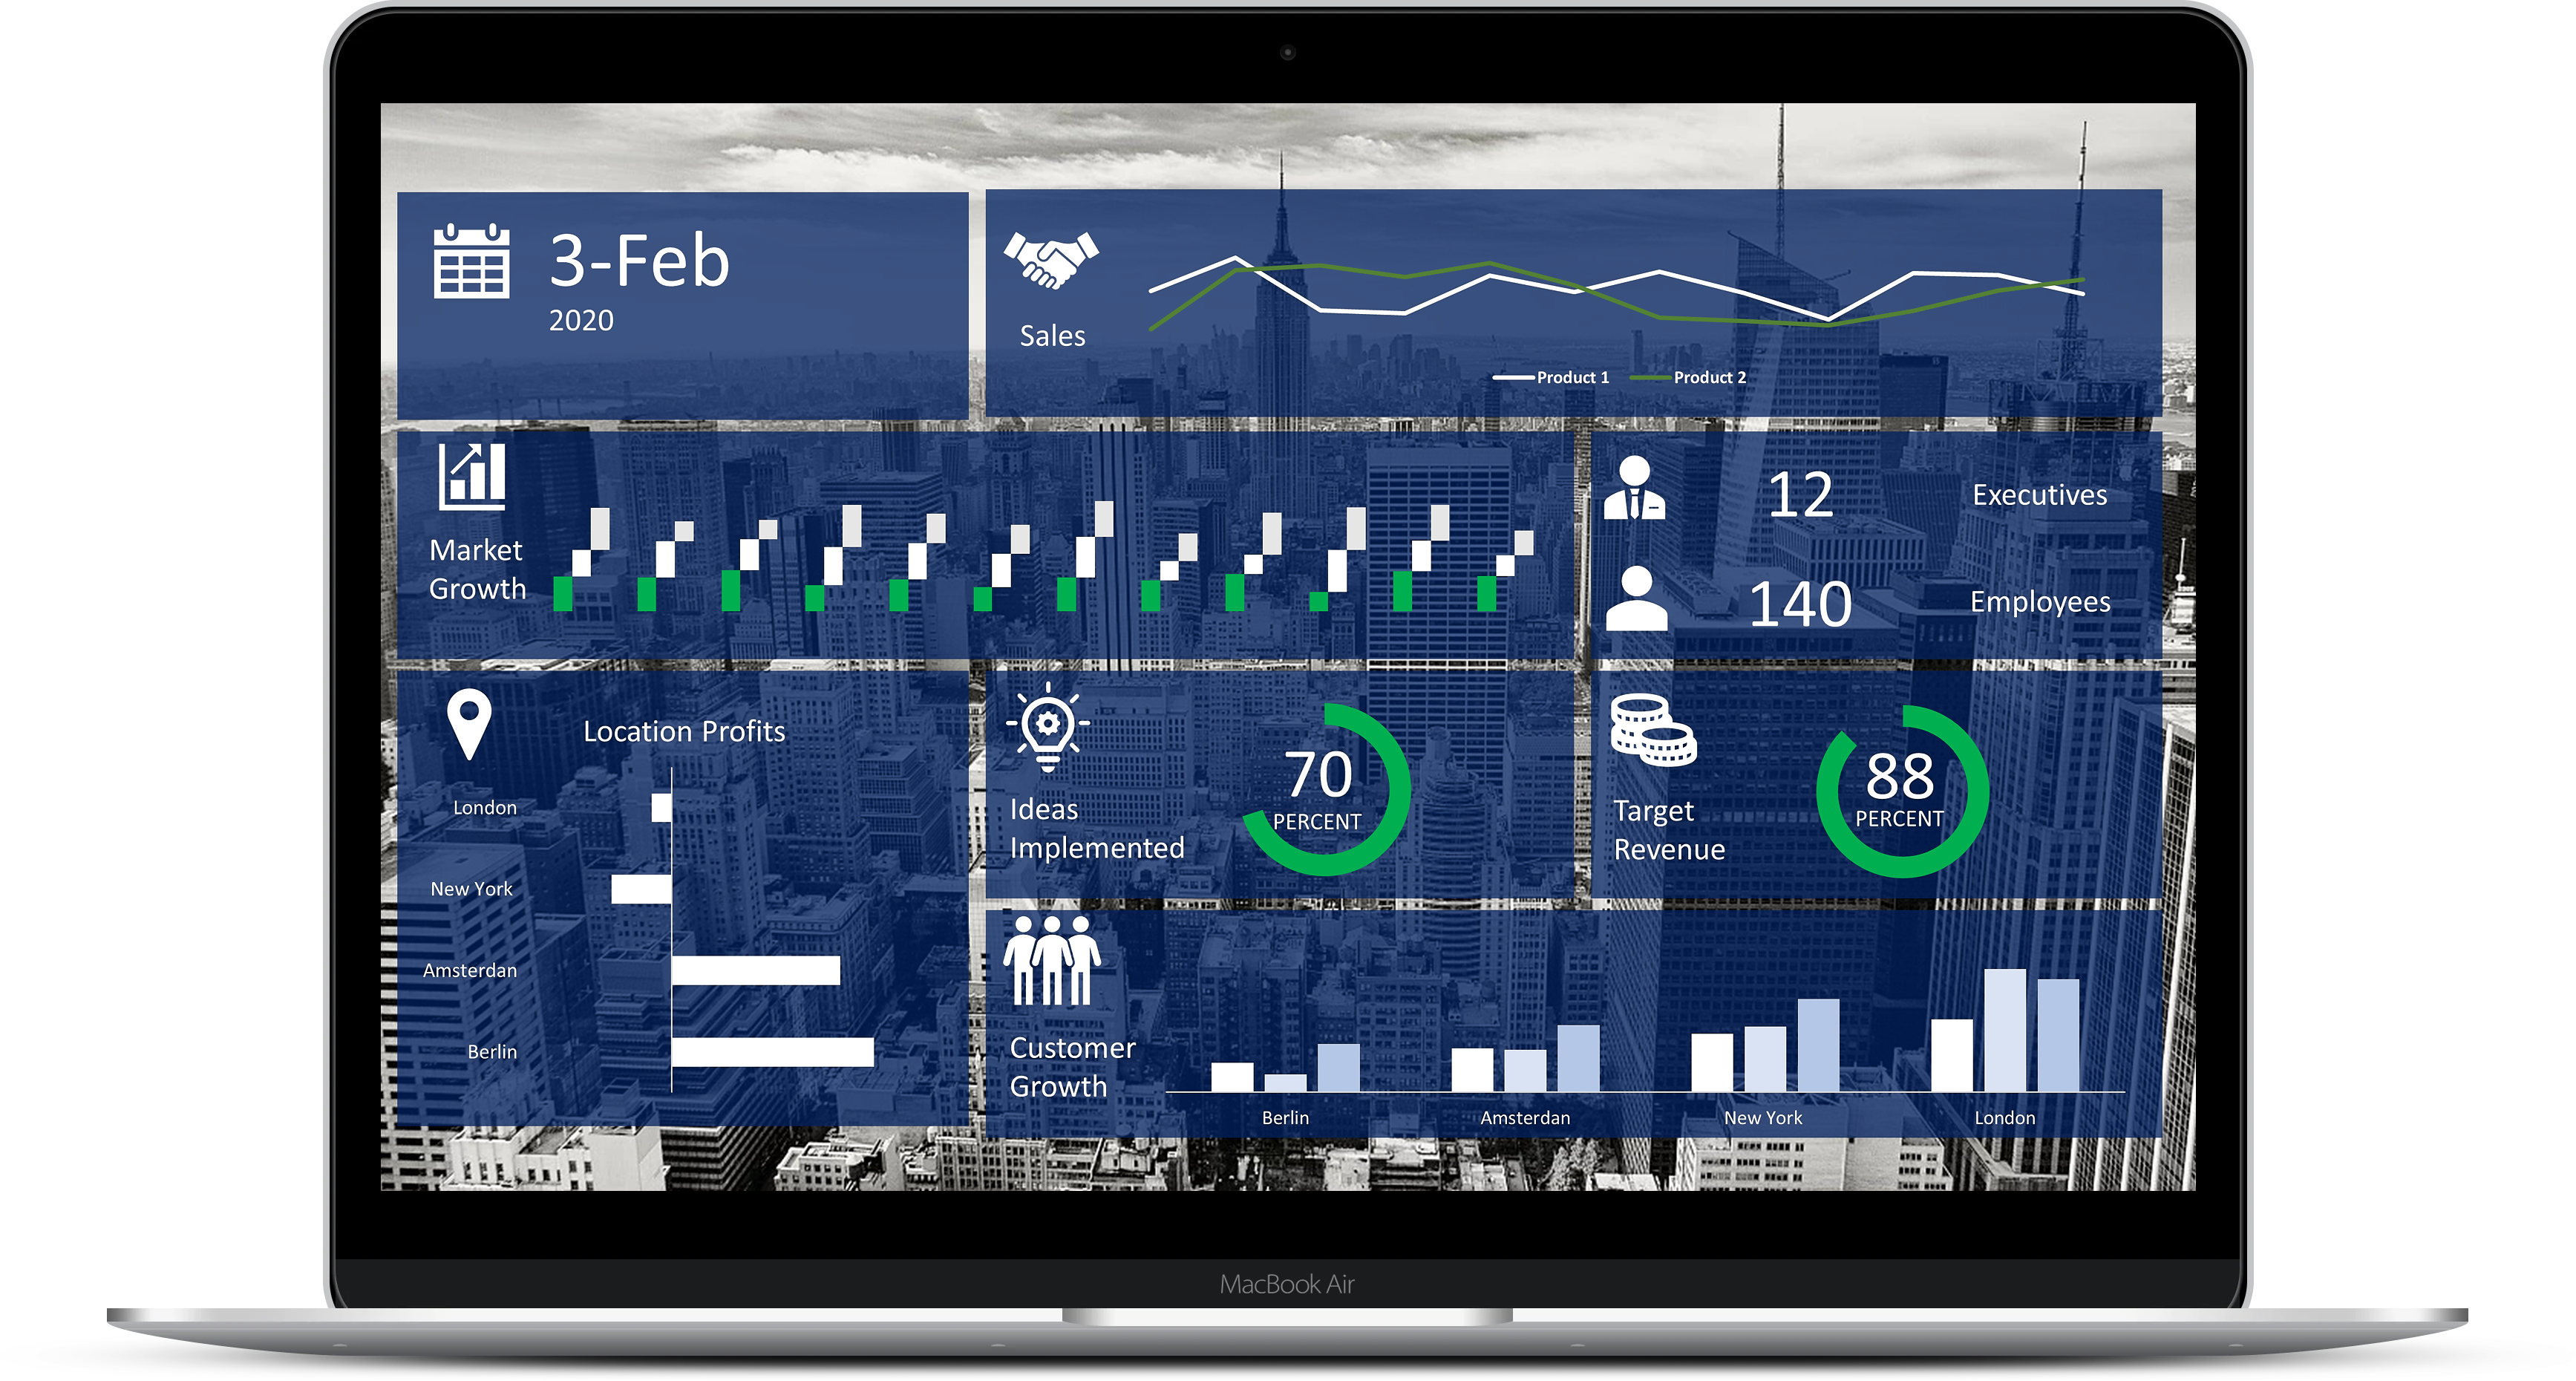
Customer growth dashboard that shows the growth amount over time for particular customer & market segments. Developed using Excel, VBA, and Powerpoint.
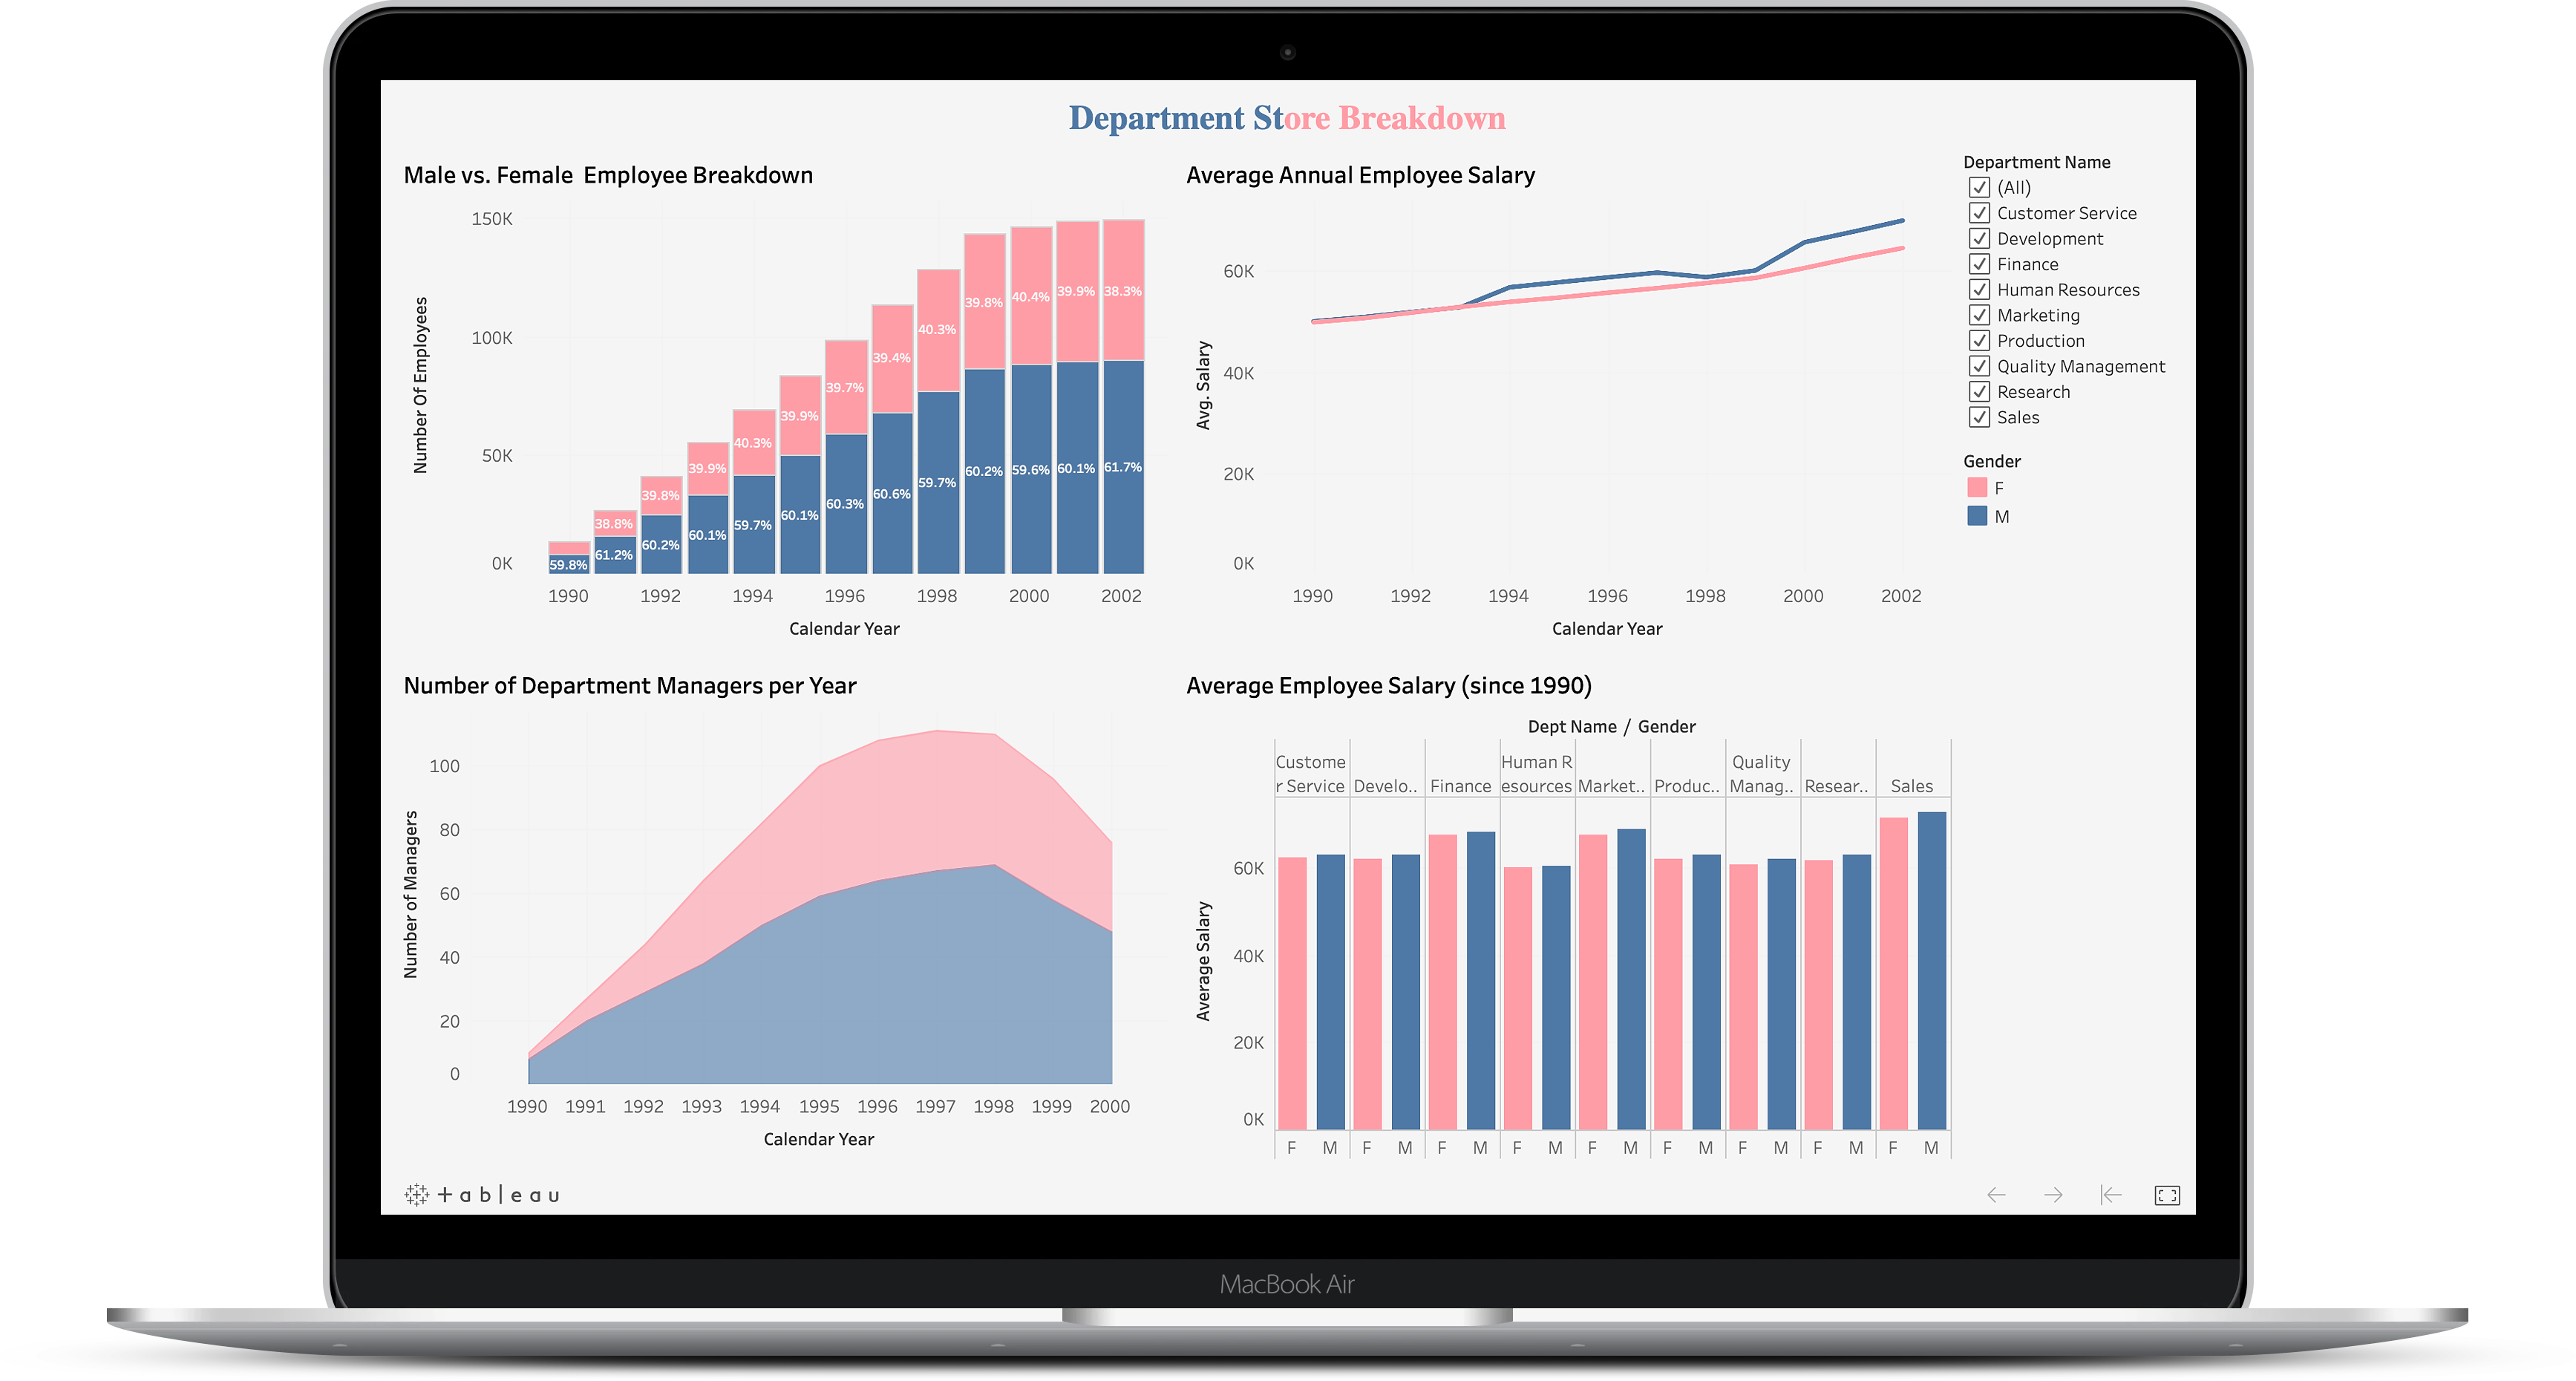
Department store breakdown that displays the average compensation metrics for males/females across departments. Developed using Tableau and Excel.
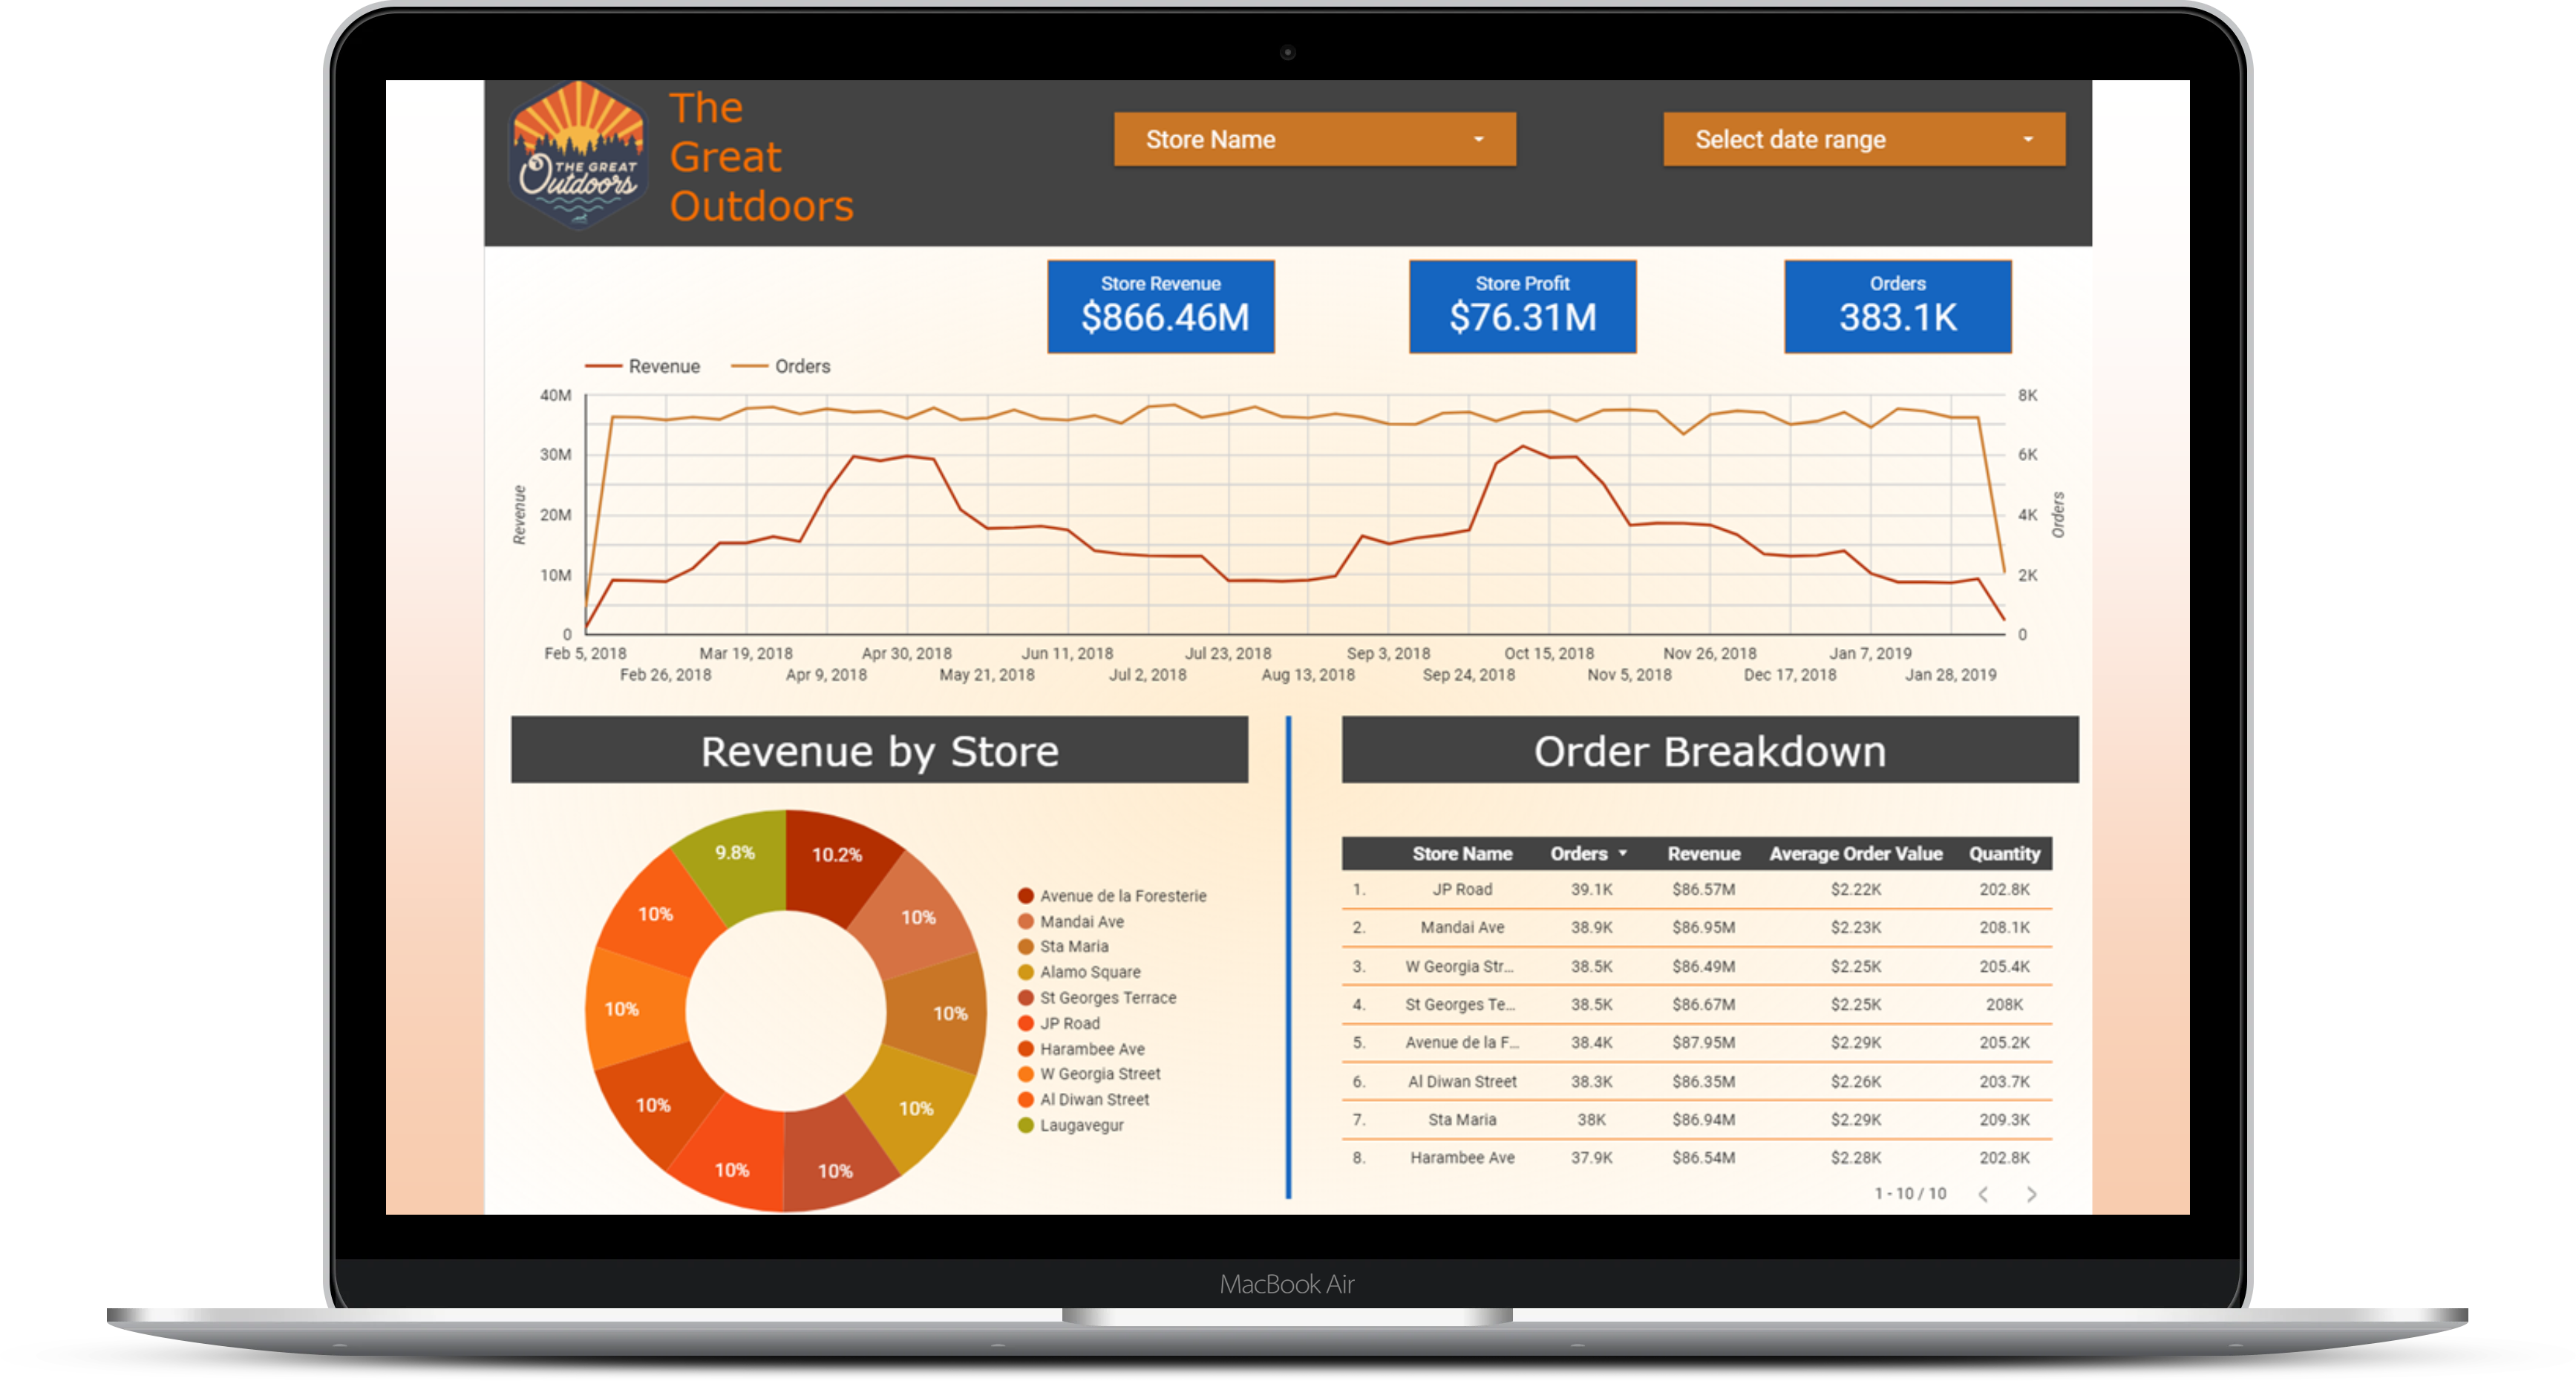
Great Outdoors sales report that displays the total revenue amount by store. Developed using Google Data Studio + Google Sheets.
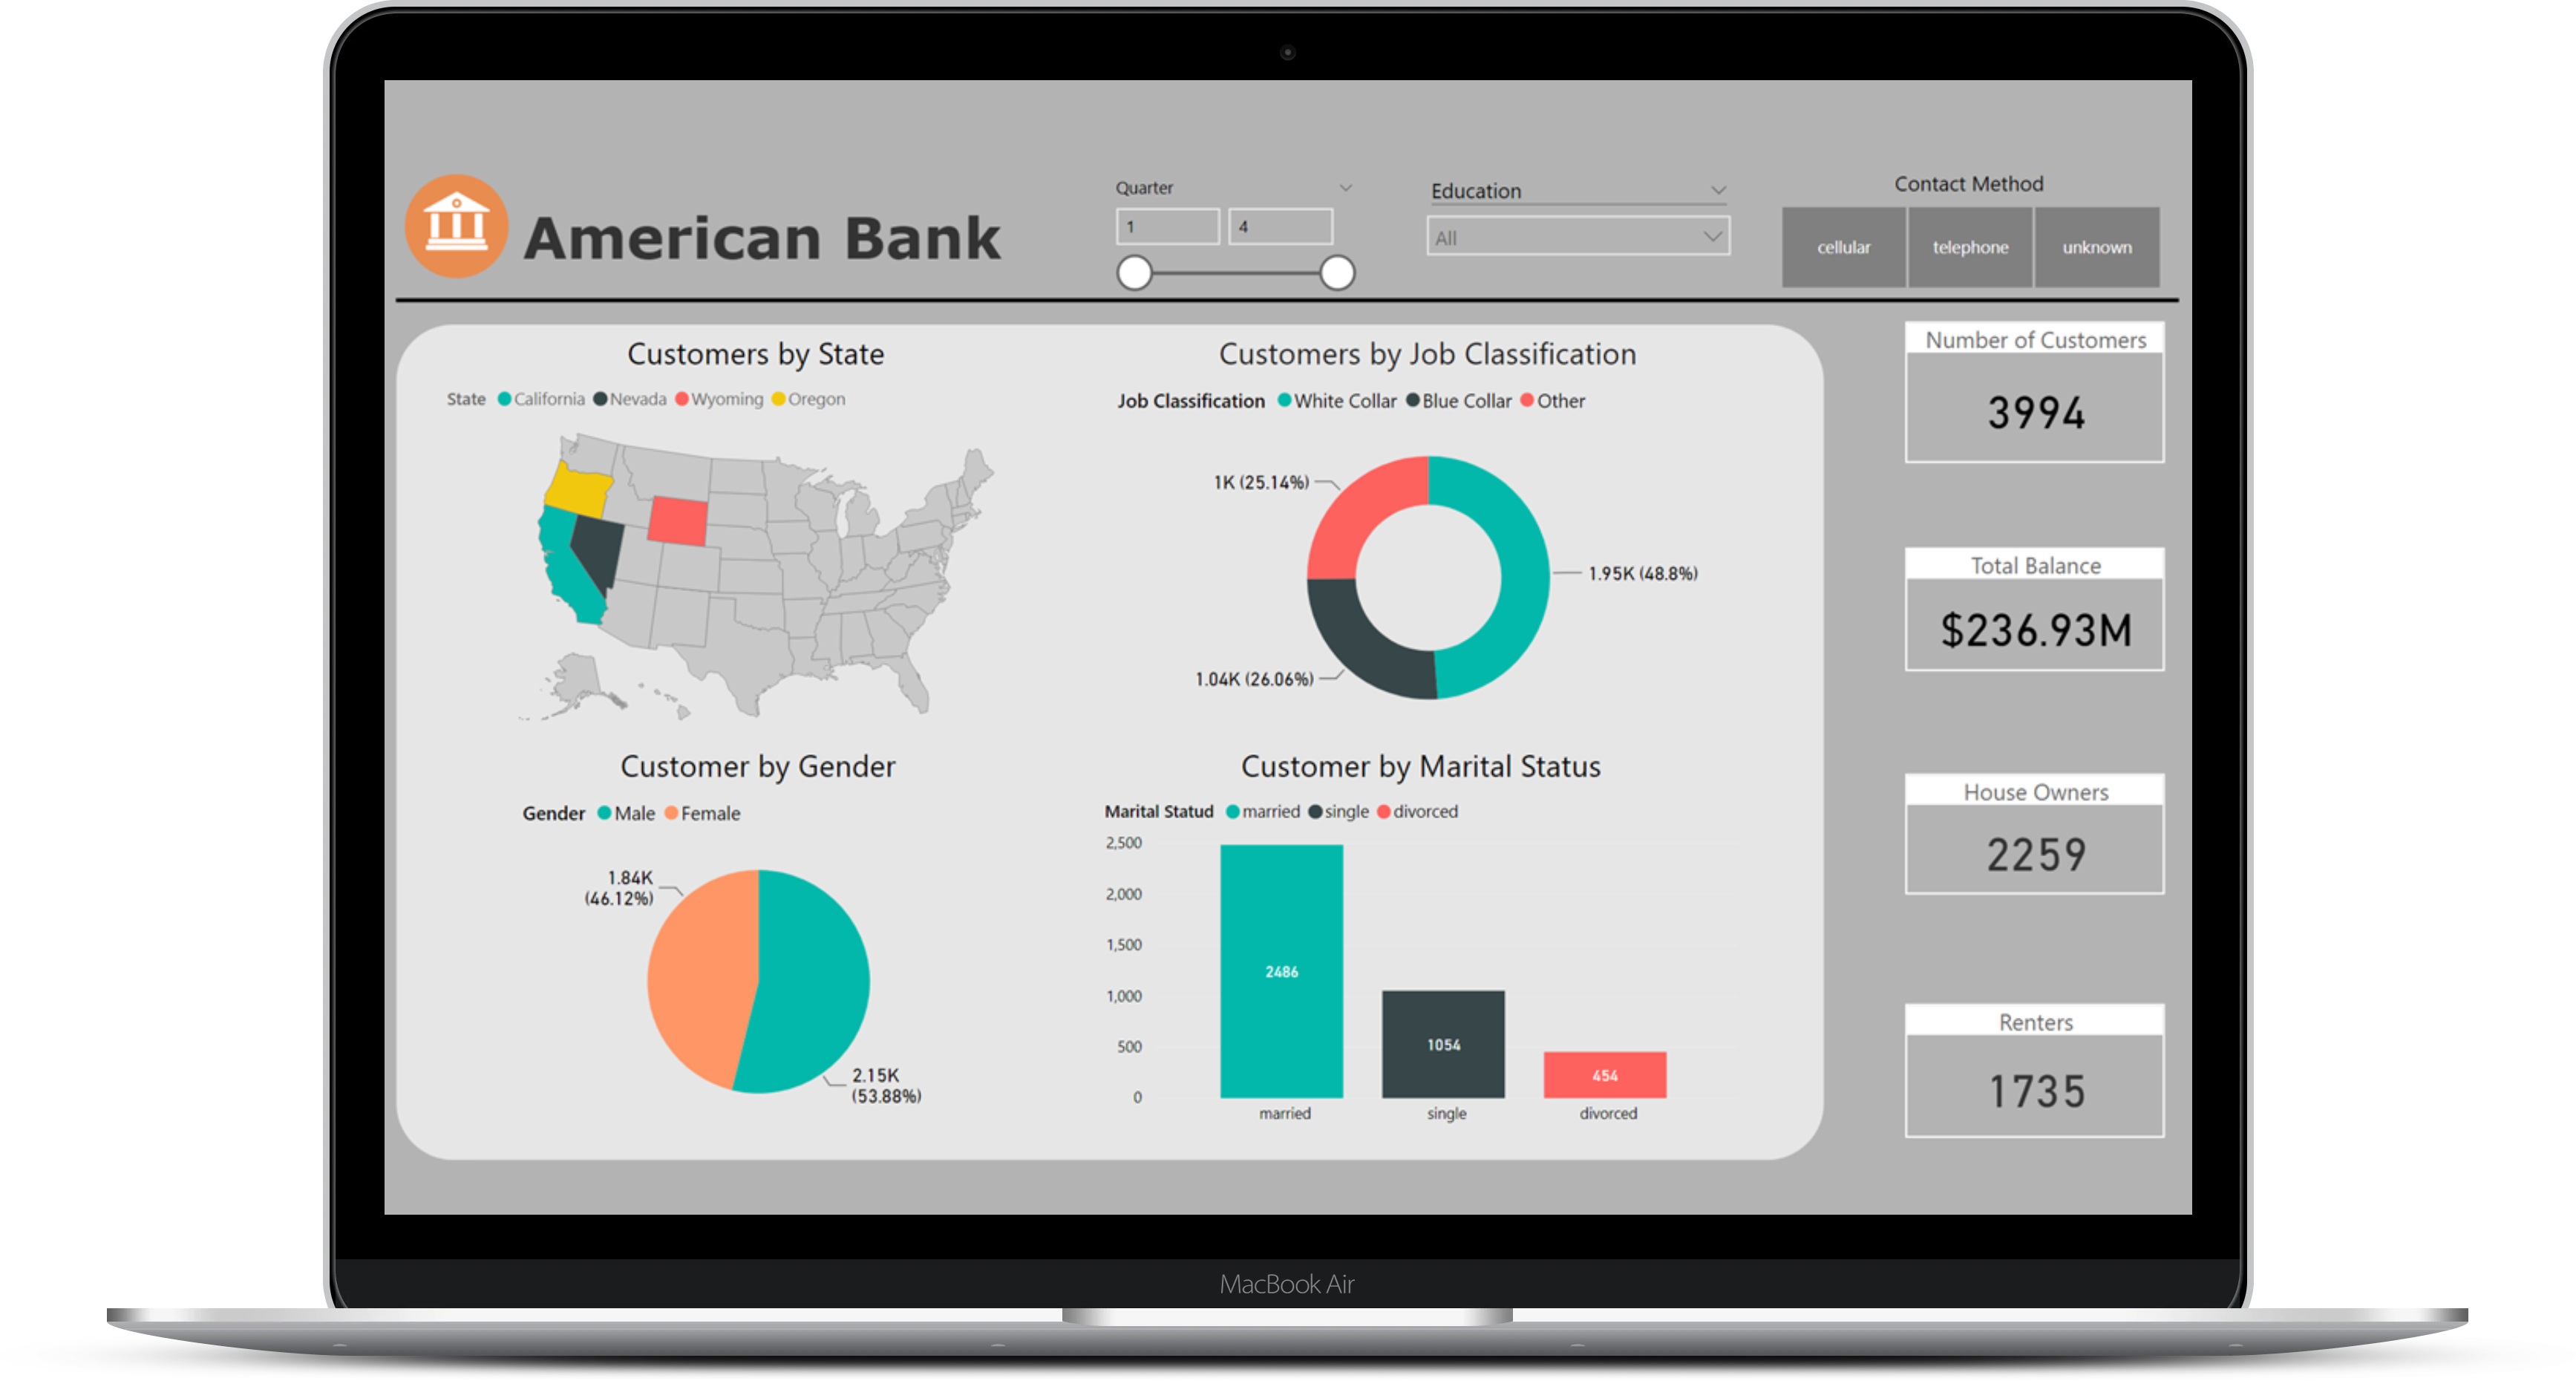
Customer banking report that analyzes key consumer metrics based on job classification. Developed using custom DAX measures and SQL Server.
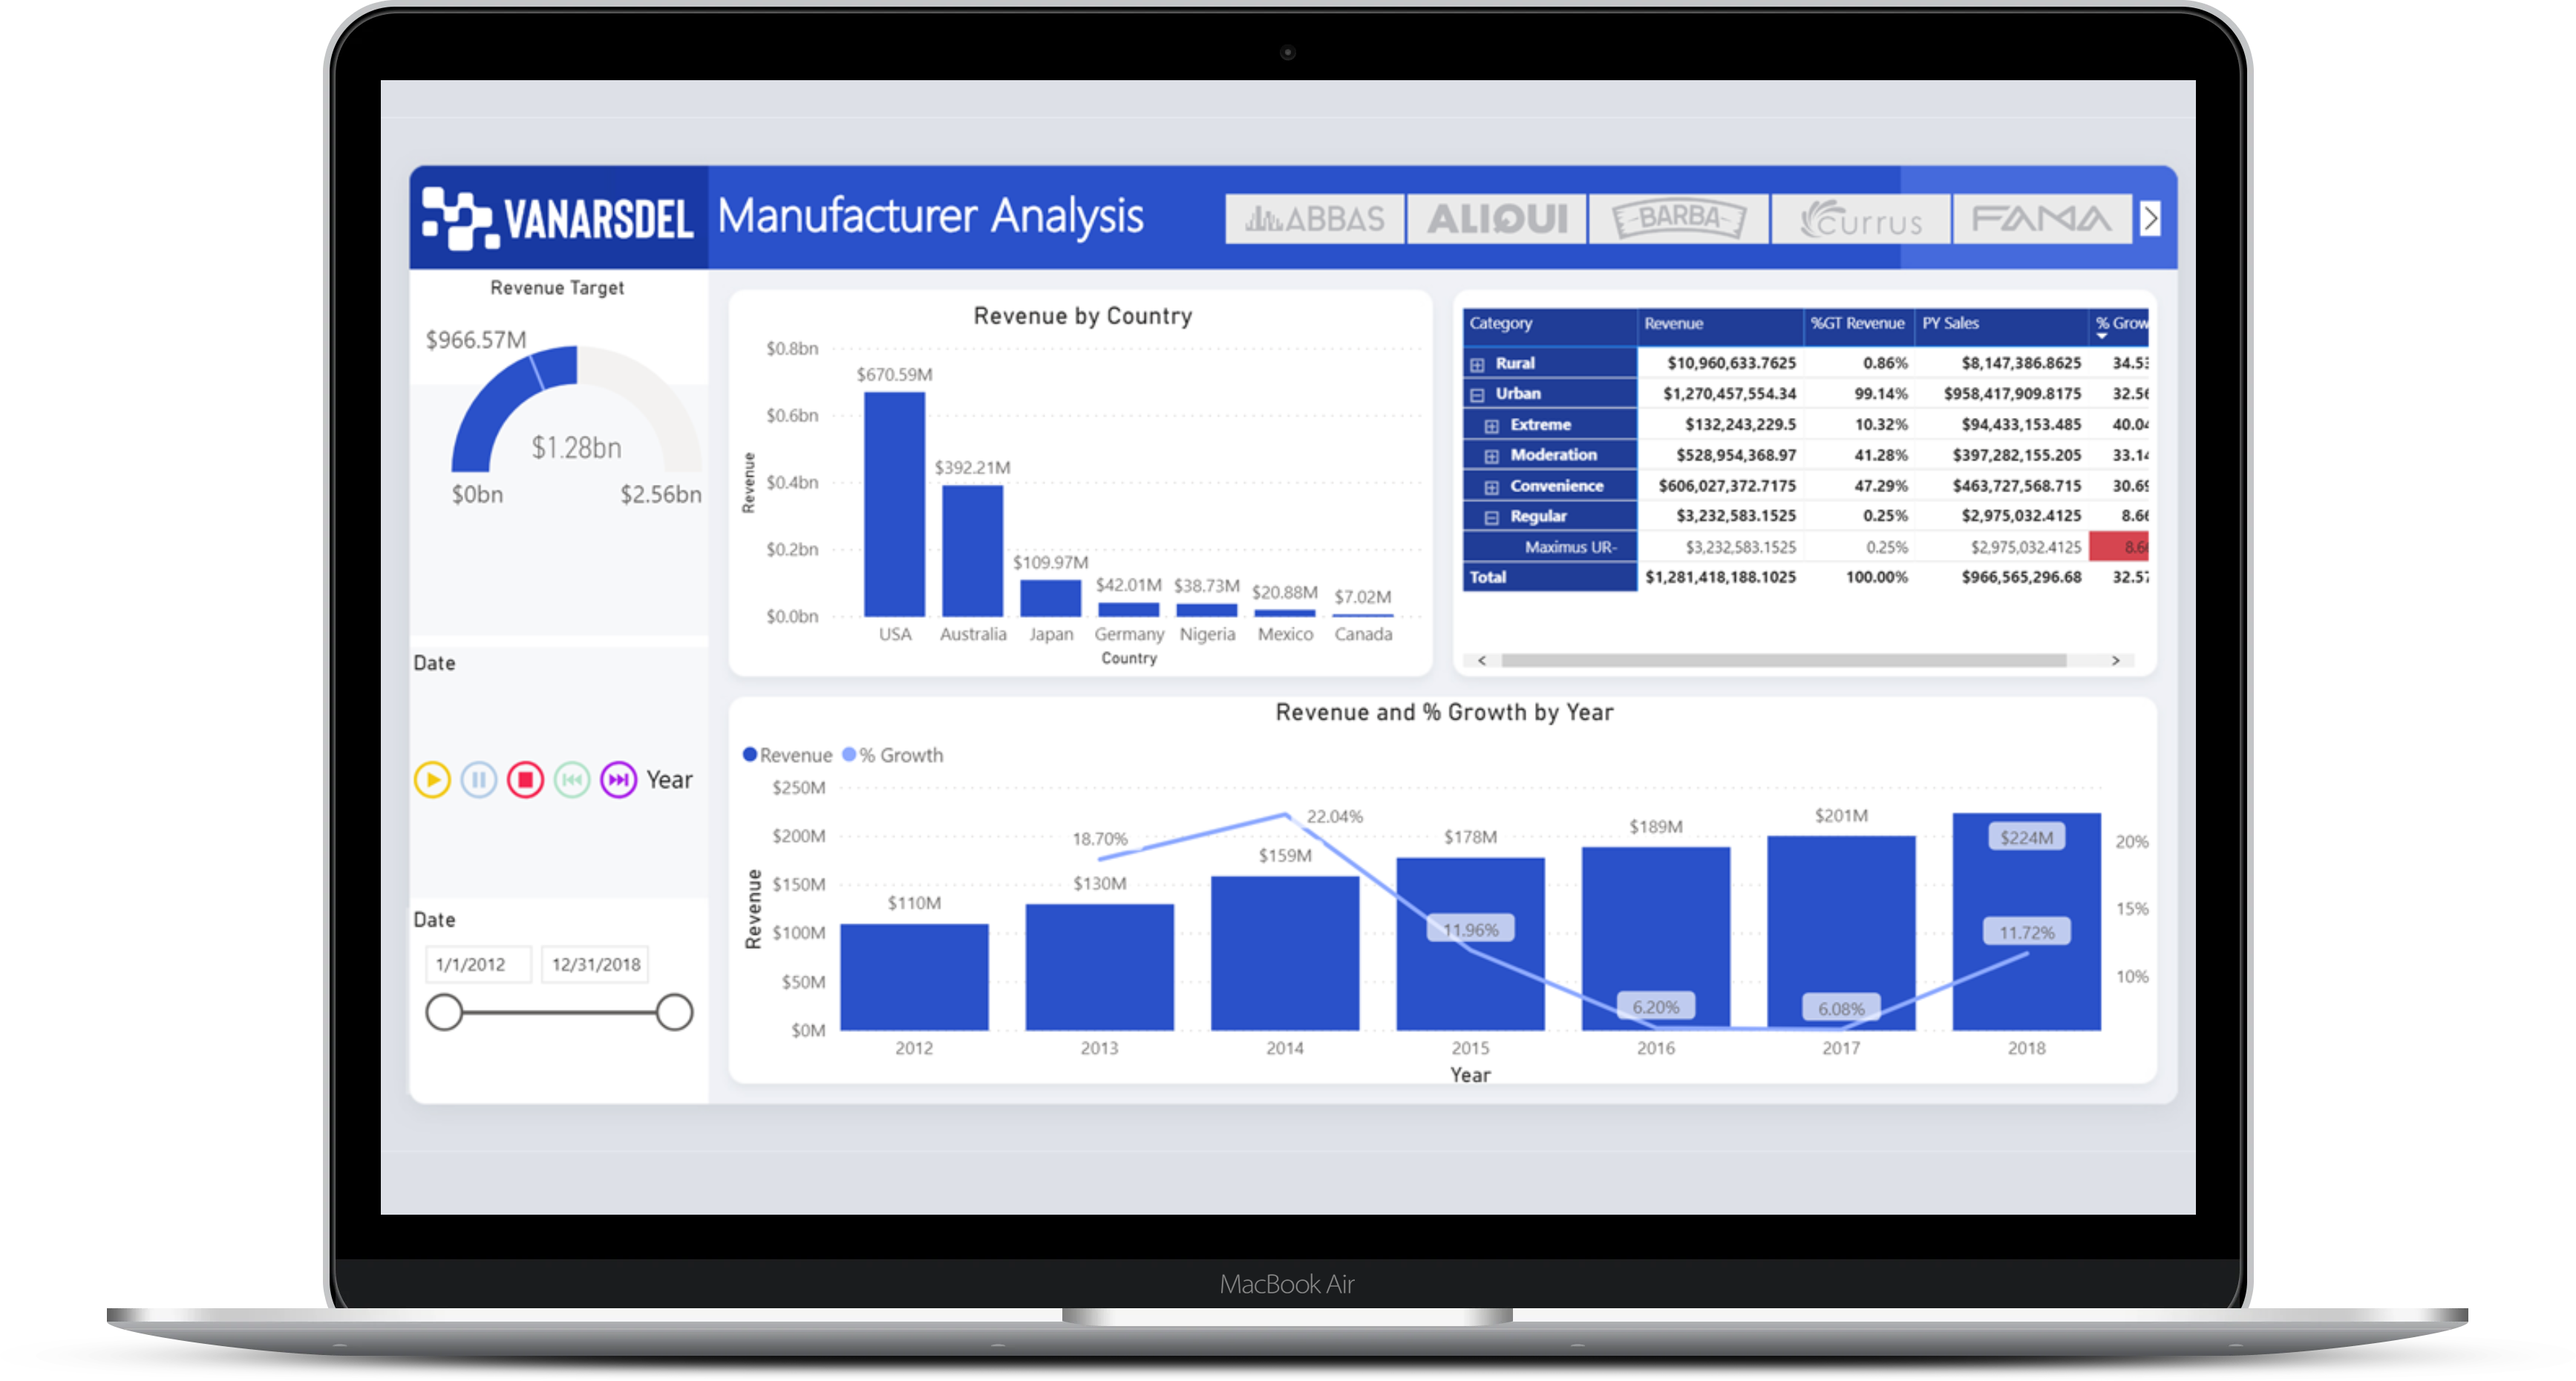
Manufacturer analysis report that displays growth revenue for various categories by country . Developed using custom DAX measures and SQL Server.
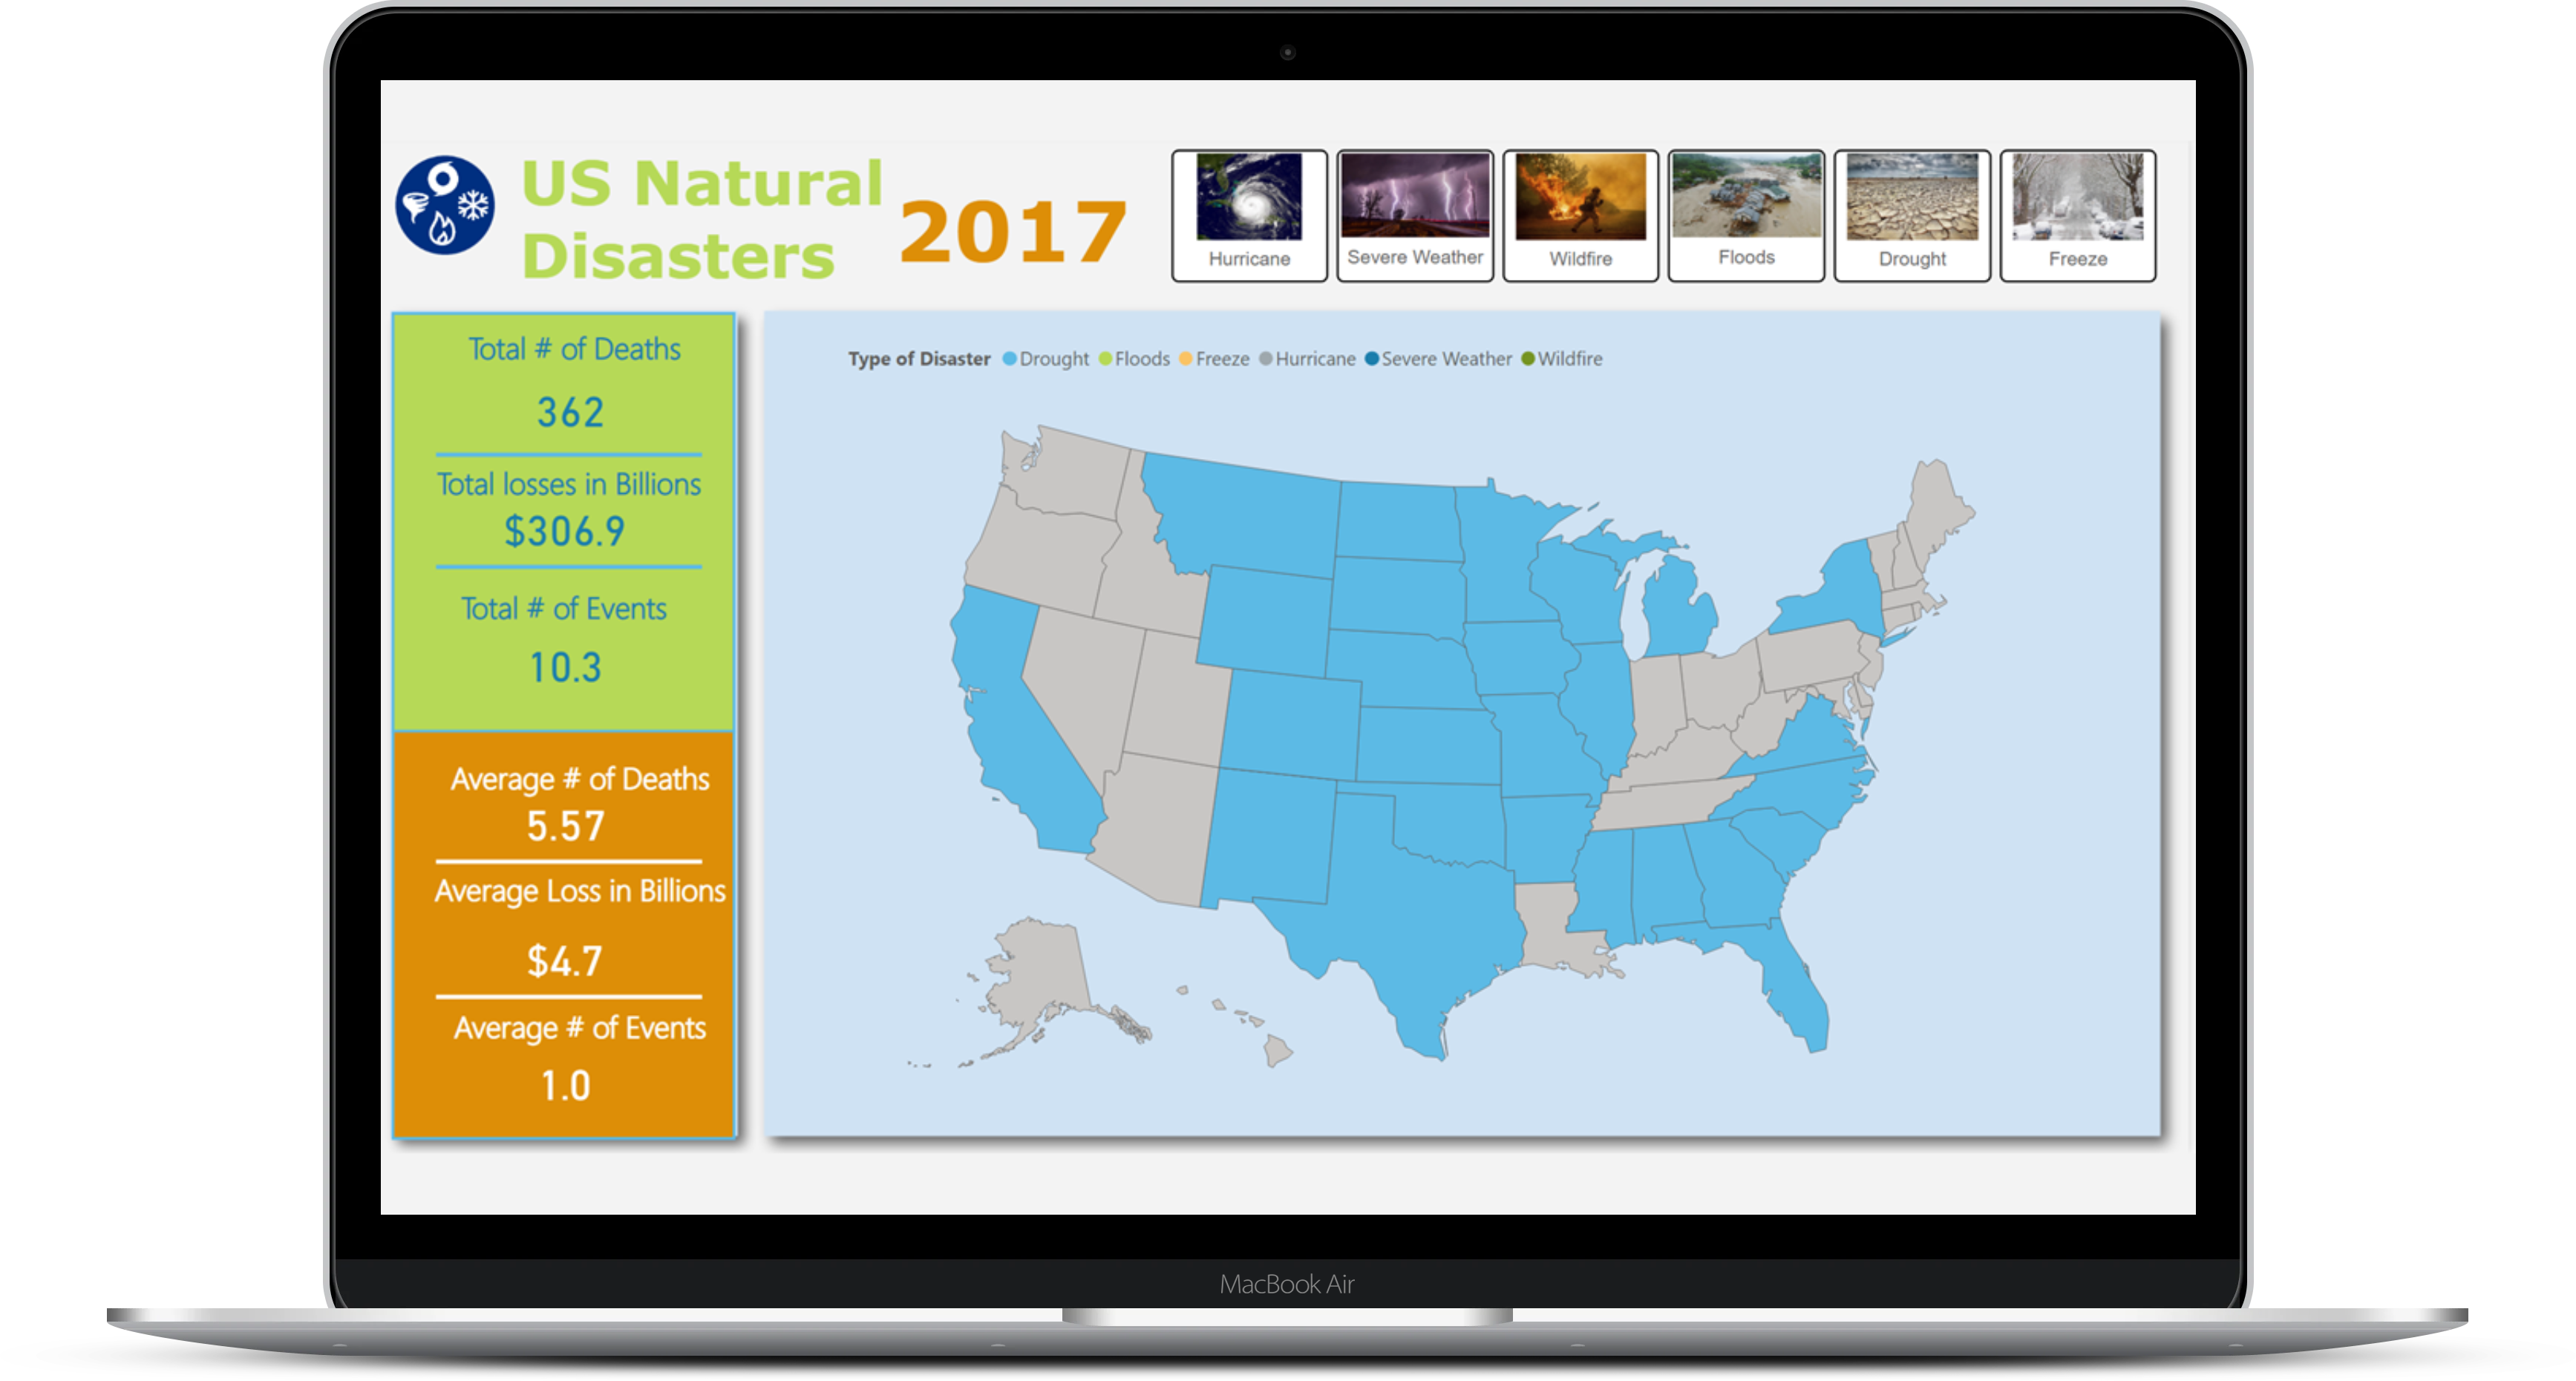
Natural disaster report that displays information on the total casualty count and revenue loss by state. Developed using custom DAX measures and SQL Server.
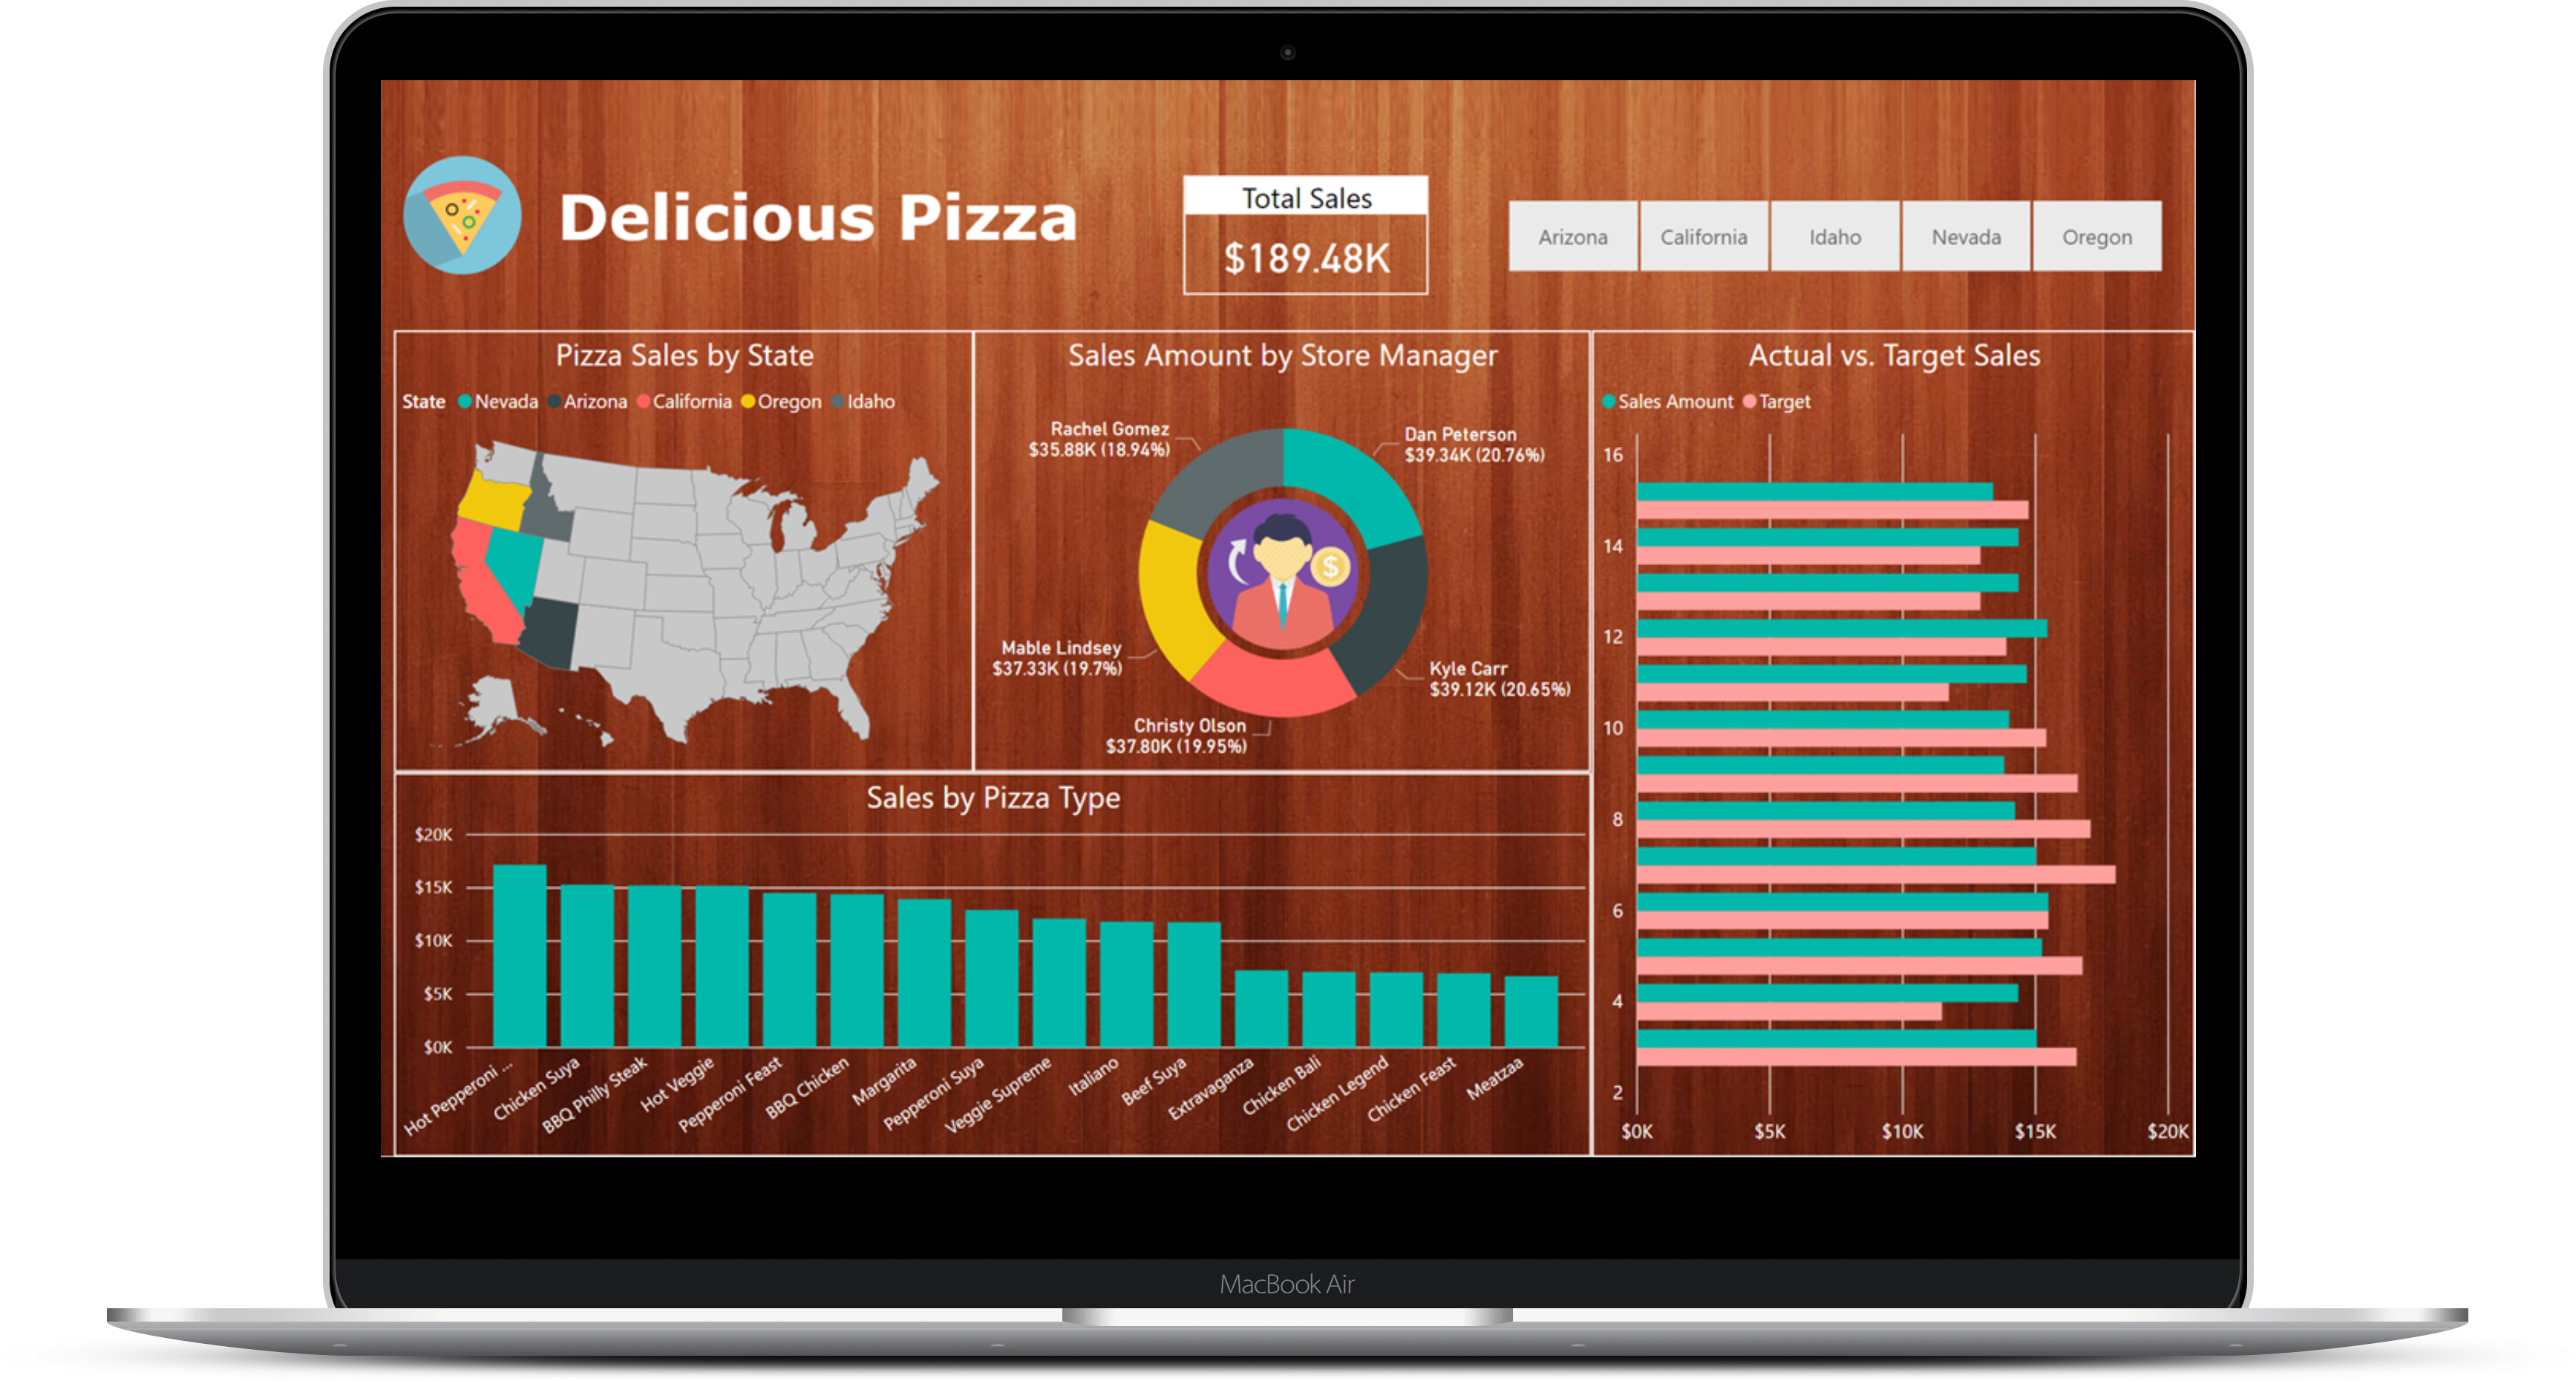
Pizza sales report that shows the actual vs projected sales for a ficticious pizzeria. Developed using custom DAX measures and Excel.